Urban Space Categorization
Categorizing urban space based on visitor density and diversity - A view through social media data
Chuang, I. T., Chen, Q., & Poorthuis, A. (2023). Categorizing urban space based on visitor density and diversity: A view through social media data. Environment and Planning B: Urban Analytics and City Science, 50(6), 1471-1485.
Analyses of urban spaces have often stressed the importance of both the density and diversity of the people they attract. However, the diversity of people is a challenging concept to operationalize within the context of urban spaces, which is why many evaluations of urban space have relied primarily on density-based measures. We argue that a focus on only one of the two aspects misses important aspects of the variety of urban spaces in our cities. To address this, we design a methodology that evaluates both the density and diversity of human behavior in urban spaces based on geosocial media data. We operationalize density as the frequency of tweets from visitors to a particular location and diversity as the variety of the home neighborhoods of those visitors. Taking Singapore as a test case, we identify networks between the home neighborhoods of 28k Twitter users based on 2.2 million geolocated tweets collected between 2012 and 2016. Based on these data, we categorize the urban landscape of Singapore into four ?performance? categories, namely High-Density/High-Diversity, High-Density/Low-Diversity, Low-Density/High-Diversity, and Low-Density/Low-Diversity. Our findings illustrate that this combined indicator provides useful nuance compared to differentiation between well and less performing spaces based on density alone. By enabling a categorization of urban spaces that fits closer to the diversity of human behavior in these spaces, human mobility data sets, such as the social media data we use, open the door to a practical evaluation of the design and planning of our heterogeneous urban environment.
Introduction
Density and diversity are key aspects of the urban environment, each with their own characteristics. Density of people and the built environment is often considered as a prerequisite for a vital and sustainable city (Jacobs, 1961: 205), whereas diversity, too, plays a key role in fostering a dynamic and active city life (Montgomery, 1998). However, rapid urban growth—as we have seen over the last decades—can also be at odds with the ostensible heterogeneity of a vital city. Modern cities can run the risk of providing a relatively dense yet segregated or even homogeneous urban landscape (Mumford, 1961; Trancik, 1986). On that account, urban thinkers and designers as far back as the 1960s have advocated for the role of diversity in reviving or safeguarding this essential quality of urban life (Cullen, 1961; Jacobs, 1961).
However, to actually measure or empirically identify diversity whether it relates to the physical characteristics or social dimensions of urban spaces, is a formidable challenge. Venturi et al. (1997) pointed out that the design of our built environments relies mostly on“decorative shades” of standard boxes. The physicality of building facades may appear in a mix of shapes and sizes but do not necessarily reflect their uses and programs. Therefore, the physical diversity of the urban landscape is often approached in conjunction with variety of services and activities that the built environment offers (Carmona, 2001, 2019). Similarly, social diversity can be challenging to measure directly but can, for example, be proxied by the diversity of uses in an urban environment (Jacobs, 1961; Talen, 2012). This is why studies of urban diversity have adopted neighborhood- level land use (Fuentes et al., 2022; Talen, 2005), housing typology mix (Talen & Lee, 2018), and policy controls (Kleinhans, 2004) as indicators of social diversity in urban areas. More recent studies have also started relying on digital technologies and big data resources to analyze, for example, the diversity of building footprints (Scepanovic et al., 2021) and changes in neighborhood characteristics from street view (Naik et al., 2017) to evaluate social diversity at large.
In this research, instead of quantifying diversity from the physical environment or“use” perspective, we focus on the“user” dimension analyzing spaces from the perspective of different visitor groups. This perspective of the visitor, which constitutes one critical aspect of social diversity, can help capture meaningful insights around diversity and the formation of social capital at both neighborhood and urban levels (Glaeser et al., 2002). Thus, we explore more directly how this visitor-based approach can complement our understanding of the different characteristics of urban spaces. Diversity in our approach is the co-location of people from various neighborhoods. Therefore, instead of viewing urban spaces through the functional lens of housing, work, recreation, and transportation (Cullen, 1961; Mumford, 1961; Zivkovic, 2019) that construct the physical form of the city, we analyze the social dimension of urban spaces through the daily mobility of people.
During the last two decades, geolocated social media has become prolific data sources to measure different aspects of urban spaces (Martı et al., 2019). This type of data allows us to conduct analysis to be at a granular scale than previously was possible by traditional, on-site data collection methods. More so, the detailed nature of these datasets and the ability to connect data over longer time periods, create opportunities to start to measure more intangible aspects of urban spaces, such as quantifying the diversity of participants of urban spaces, as we do in this article.
However, research utilizing geosocial media data often relies on metrics derived from the frequency of posts, essentially measuring density, as a proxy for the activity or“vitality” of a specific geographic location (Chen et al., 2019; Kim, 2018). Although a certain density of people might be an important contributor to an active social environment, there does not need to be a direct, linear correlation with diversity (Talen, 2012). Diversity differs from density in the urban design context because diversity might contribute to the potential for economic and social exchange and, ultimately, the vitality of a place (Greenberg, 1995). Furthermore, diversity in urban environments also links to social equity as it might engender access to the city for all social groups and generate opportunities for mixing and increased understanding between population groups (Talen, 2012). From this point of view, we argue studies of urban vitality can be significantly enhanced by not only using density-based metrics but also including a specific diversity dimension.
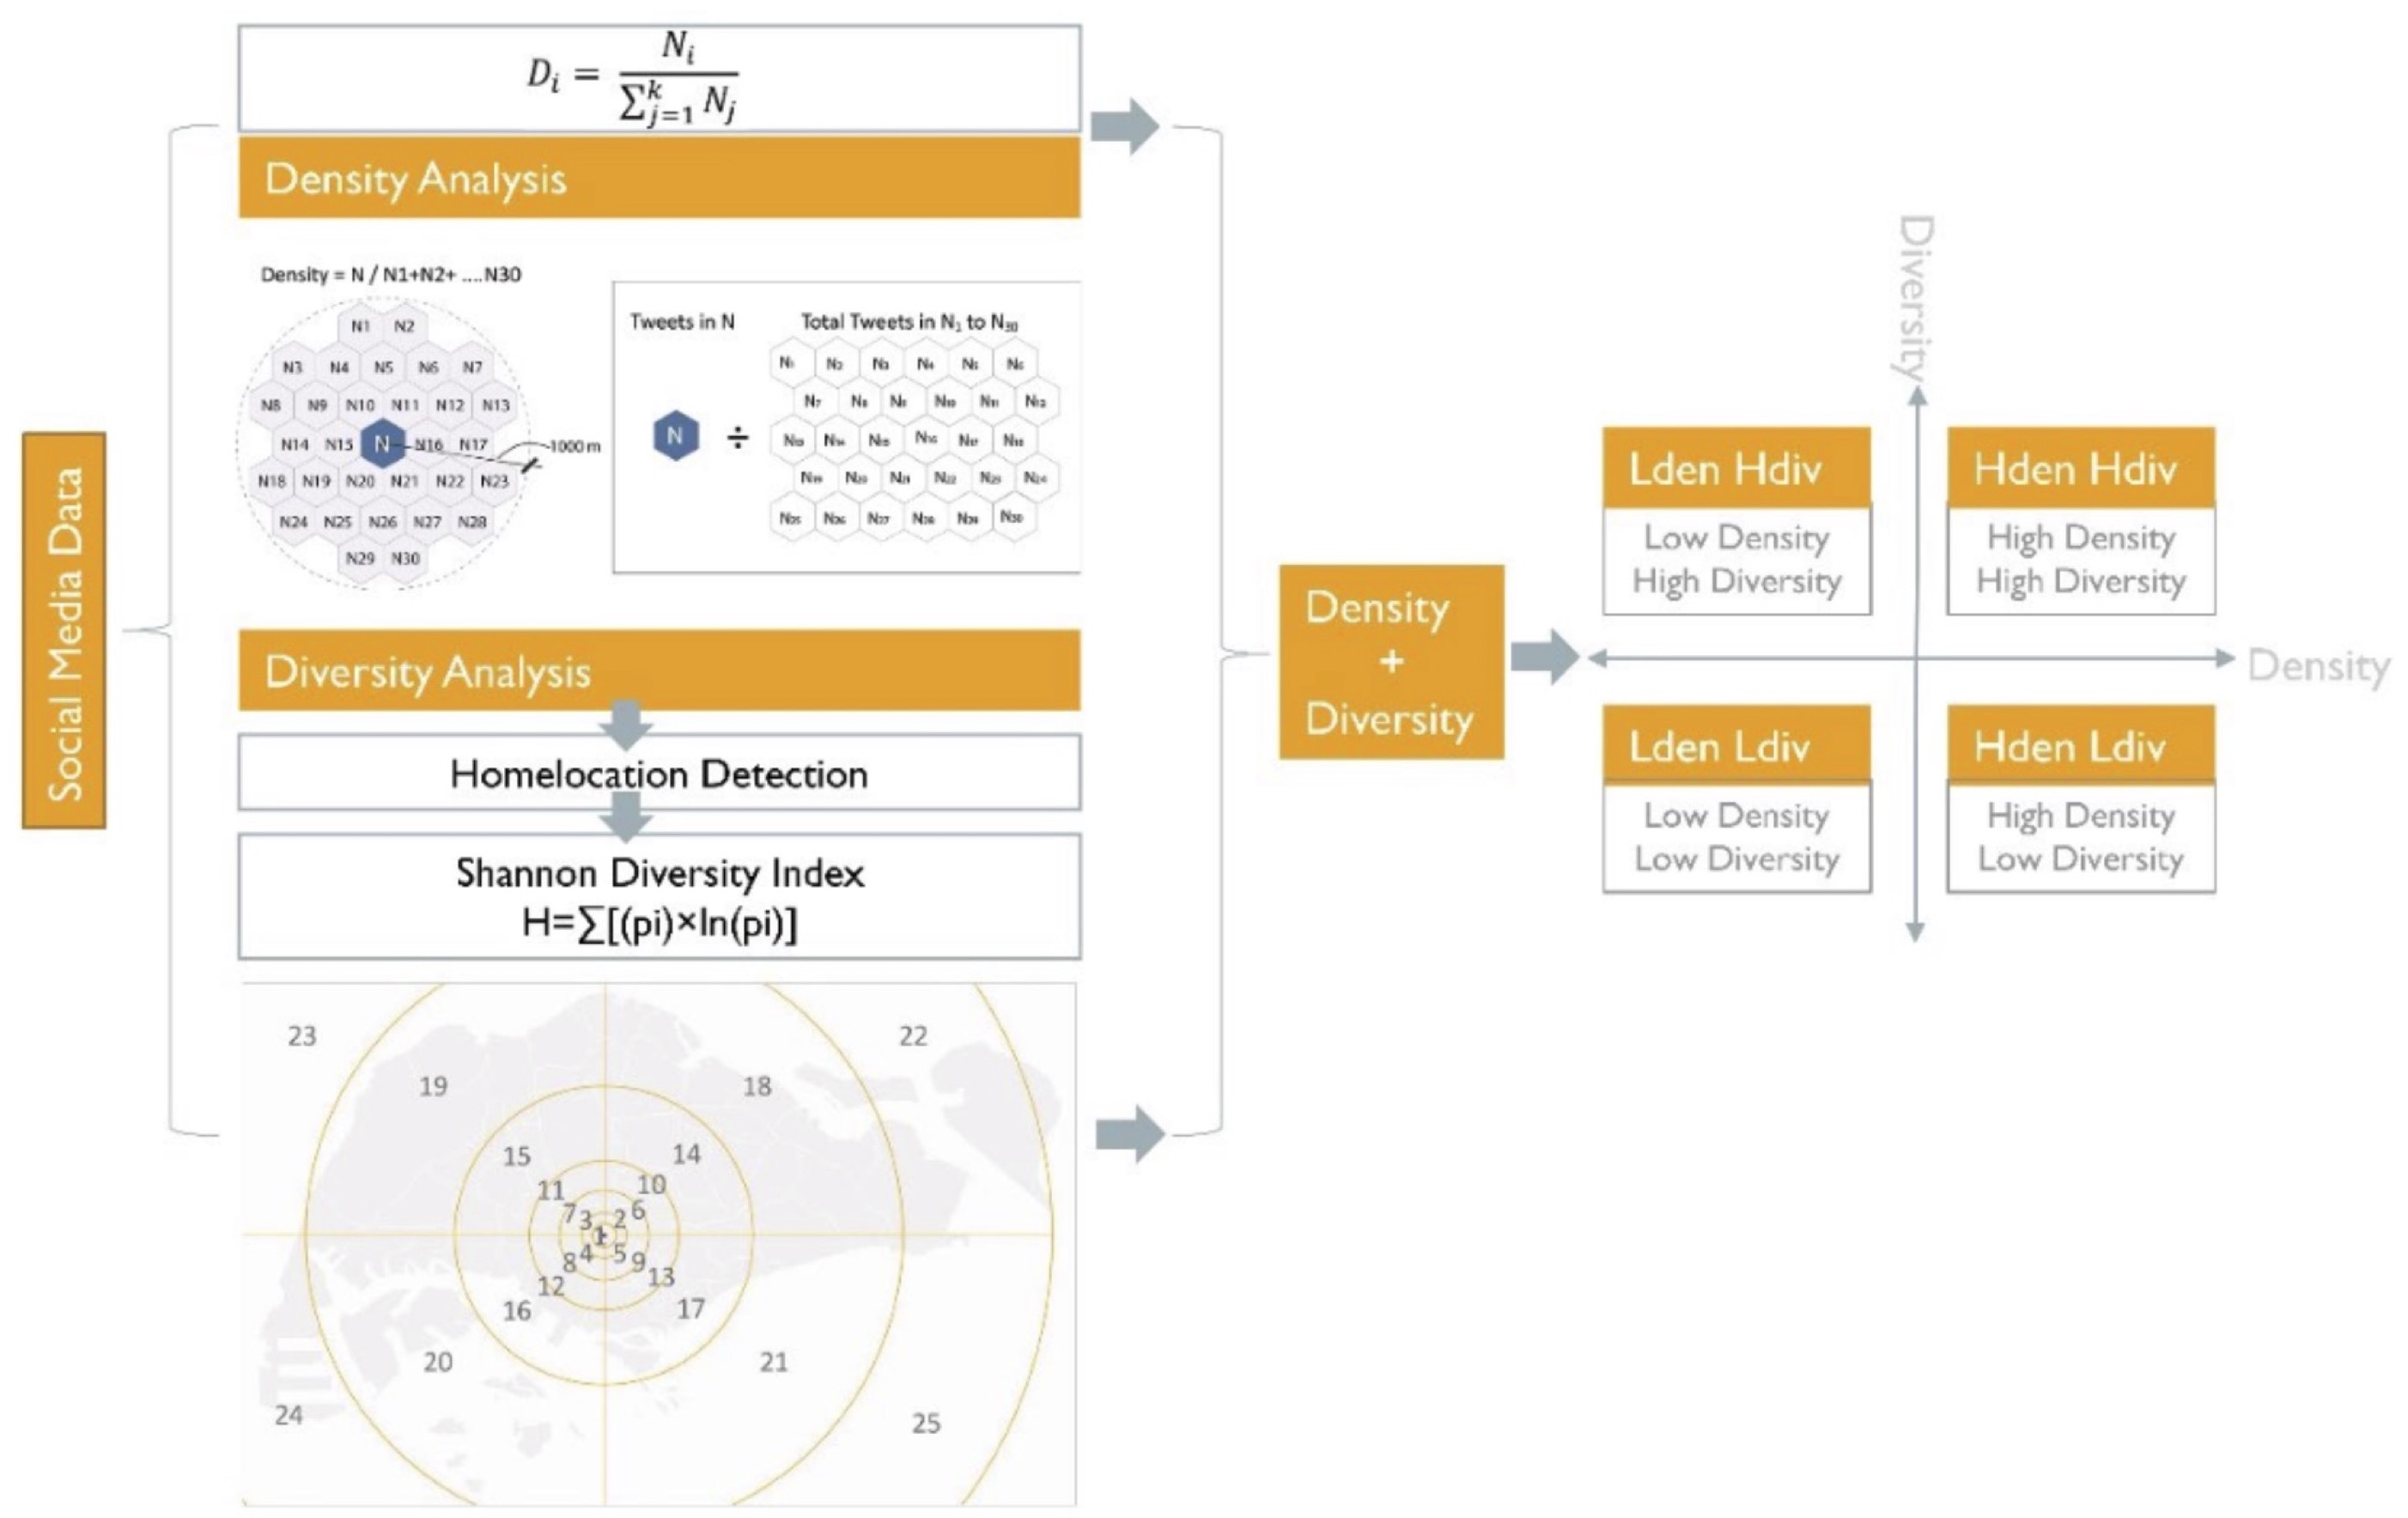
Here, we leverage geosocial media, Twitter specifically, to quantify this relatively intangible aspect of urban spaces. We first derive home locations from geotagged Twitter data and use this as a basis to construct networks of flows between urban locations. Then we infer diversity based on the variety of origins that visitors of a certain location have and analyze density according to the frequency of visitors within that certain location. Subsequently, we combine the two (i.e., diversity and density) metrics into a 2-dimensional categorization of the activity-level in urban spaces. In this way, we construct a bottom-up activity-based classification of urban spaces, rather than one that is based on land-use or policy-prescribed urban functions.
To illustrate this potential, we select Singapore as a case study and combine the inferred 2- dimensional categorization of each location’s activity level with land-use data to contextualize our findings. As such, the research sketches out the overall socio-spatial landscape of Singapore, with patterns of“vitality” (high density and high diversity) and“low profile” (low density and low diversity) places clearly identified throughout the city. Beyond that, most interestingly, our approach also identifies locations that might easily be overlooked if diversity would not be considered (i.e., low density and high diversity). For instance, local neighborhood parks that are loved by local residents can attract diverse visiting groups but do not draw the same crowds that popular tourist destinations do. Although these locations are valued urban amenities in spatial planning frame- works, the extent to which specific places contribute to this type of visitor-based diversity might not always be known or fully appreciated. As such, diversity-based metrics based on social media can offer an additional perspective on urban spaces study that helps urban planners and designers better understand and appreciate the variety of urban spaces in the city.
Implementation
As people move around the city, they create a web—a network—of connections between the different places they visit. In this work, we infer this network of connections from Twitter data. When users opt-in to this, tweets contain explicit coordinates and timestamps that reflect the spatio- temporal path of its creator. The more often a person tweets from a place, the more likely that place is meaningful to this person and thus the stronger the connection to that location. We use these networks to ultimately understand the specific make-up of the visitors to a particular place and by extension the social diversity of a location. As such, we are able to operationalize both the density (i.e., frequency of visits) as well as the diversity of visitors (where individuals are visiting from). To illustrate our approach, we begin by evaluating the visitor density, followed by analyzing diversity based on the variety of home locations of these visitors. We then combine these two concepts into a 2x2 matrix (see Fig. 1) that allows for the categorization of activity levels in urban spaces.

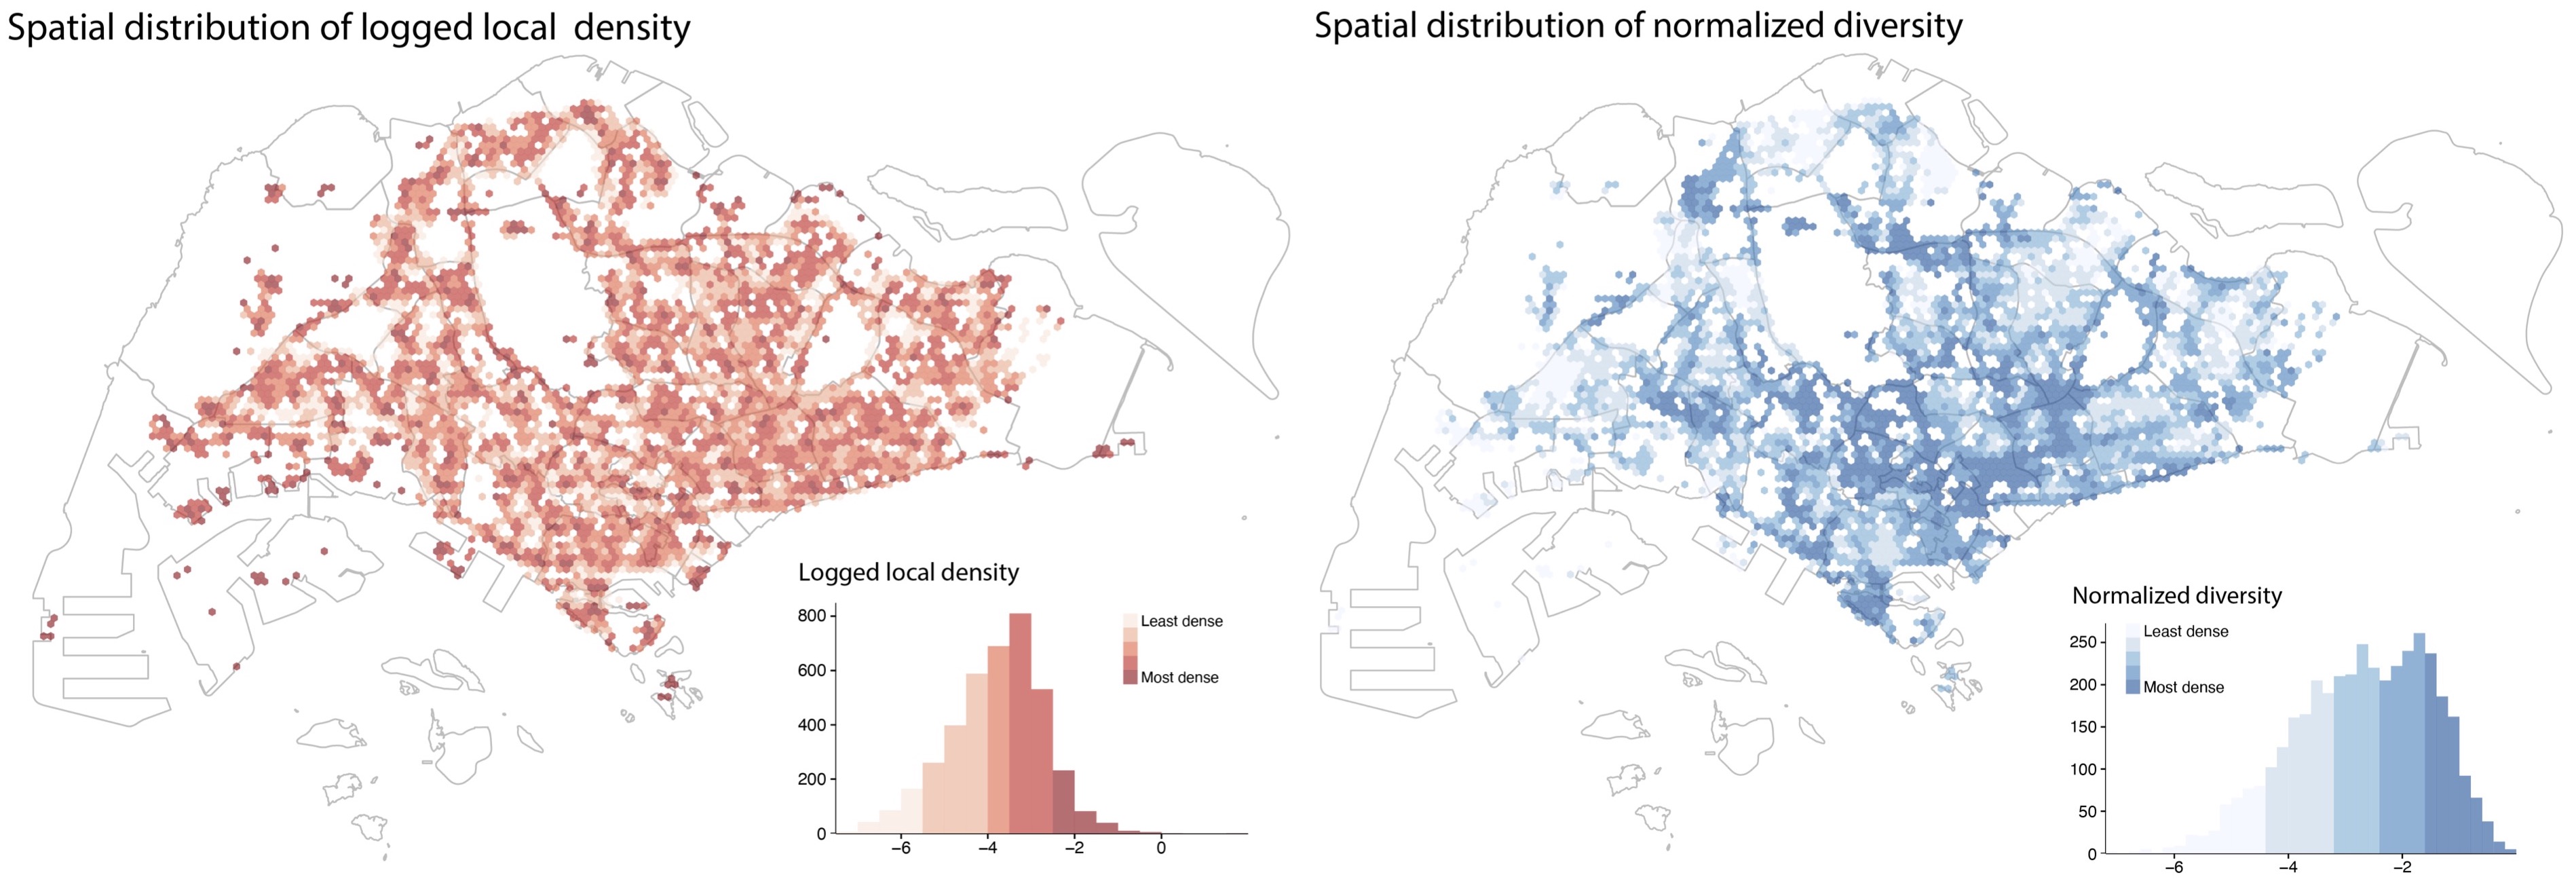
Figure 2 (left) shows the overall spatial distribution of density. To contextualize the resulting patterns, we zoom in from city-scale to neighborhood scale. The mapping of the diversity metric in Figure 2 (right) highlights the downtown area and marks the major express highways, reflecting that both roads and the downtown area generally attract a wider diversity of people than the residential neighborhoods in the peripheral ring around Singapore (colloquially referred to as “the heartlands” in Singapore).
However, the two metrics are independent of each other in the sense that high-density places can certainly have a low diversity in the origin of visitors (e.g., HDB housing), or high-diversity places can have a limited number of visitors (e.g., Tampines Eco Green). Based on either variable individually, evaluating urban space can result in a biased assumption of what a “well-performing” (high-density and high-diversity) urban space is. Therefore, we argue that both variables should be equally considered to obtain a balanced and comprehensive view of our urban spaces.

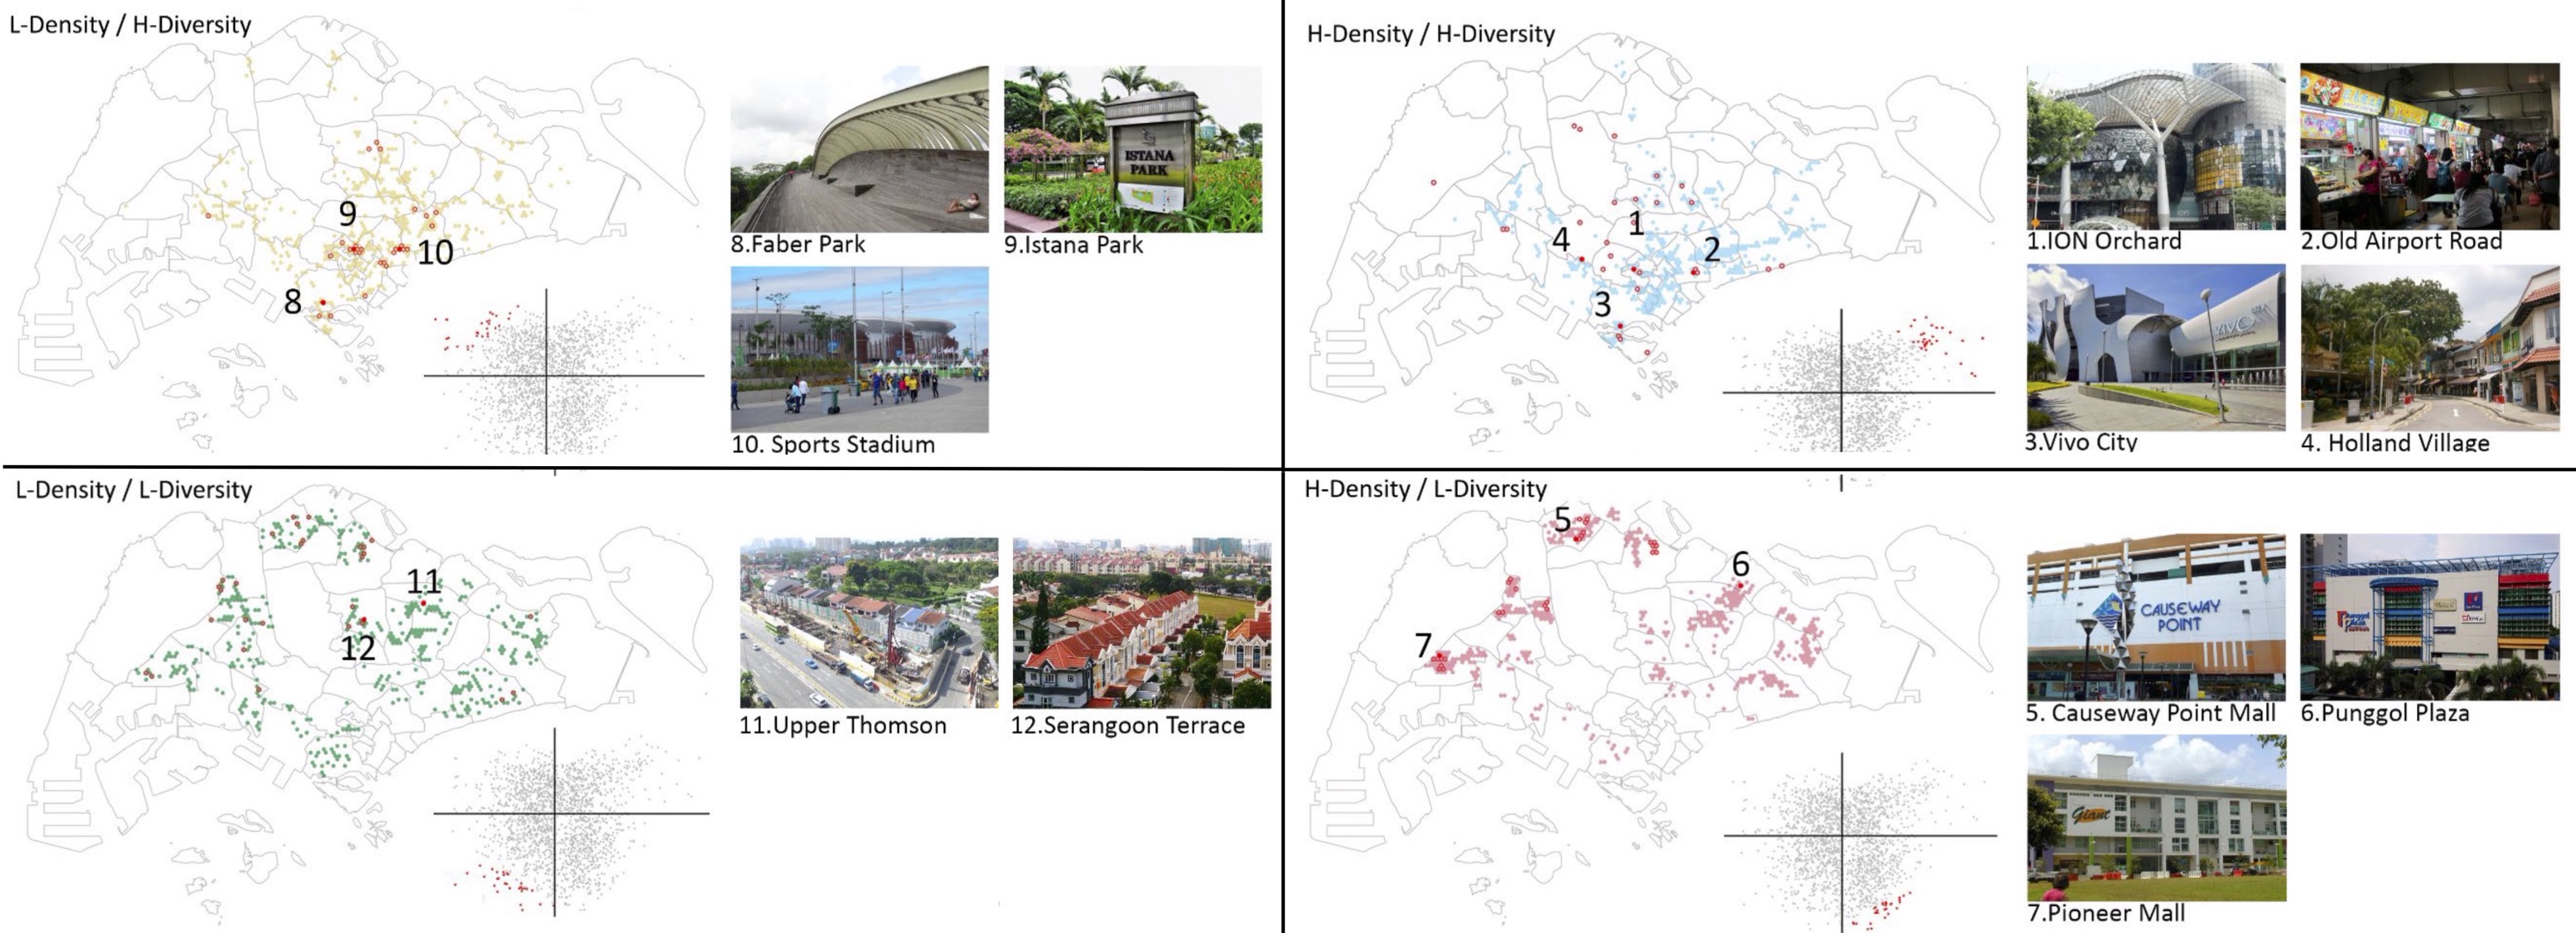
To illustrate how the combined density and diversity measure can be used to classify urban space, we take a few representative locations from the top-30 places in each category and discuss the underlying reasons that may contribute to specific activity levels in each place. Figure 3 outlines a general typology for each spatial category, where
-
H-Density/H-Diversity places are prone to be high profile tourist destinations
-
HarbourFront Vivo City, Holland Village, Orchard MRT station vicinity, and the Old Airport Road Food Centre are four well-known destinations. It is expected that these high-profile places would have both a high density and diversity of visitors.
-
-
H-Density/L-Diversity places are located mostly at high density residential neighborhoods
-
Woodlands Causeway Point Mall, Jurong West Pioneer Mall, and Punggol Plaza are fell in this category. These neighborhoods are Singapore’s “heartlands.” They are planned to be relatively self-contained to cater to residents’ daily needs with markets, shopping malls, cinema complexes, restaurants, and schools.
-
-
L-Density/H-Diversity places are identified with leisure programs
-
Istana Domain and green recreation spaces (e.g., Faber Park, Singapore sport stadium parks) are representative locations. The Istana is the official residence of the President of Singapore and its grounds are often used for state functions and ceremonial occasions. The result shows that the Istana incurs diverse but less dense visitor groups from different areas across the city, which is akin to the nature of its program.
-
-
L-Density/L-Diversity places that tend to be low density with unitary urban functions
-
Landed property neighborhoods at Seletar Hill and Thompson community. These locations are expected to have a lower density and diversity of visitors. Although they are less interesting from an urban design point-of-view, this category does provide a useful sanity check for the categorization we employ here.
-

Figure 3. Spatial categories and representative spots. (1) Ion Orchard MRT Station, photography by Fabio Achilli; (2) Old Airport Road, photography by One More Bite Blog; (3) Vivo City, photography by Wojtek Gurak; (4) Holland Village, photography by Nagono; (5) Causeway Point Mall, photography by Cmglee; (6) Punggol Plaza, photography by Deoma12; (7) Pioneer Mall, photography by Waynema; (8) Faber Park, photography by, Jordan Rockerbie; (9) Istana Park, photography by Choo Yut Shing; (10) Sports Stadium, photography by Rodrigo Soldon Souza; (11) Upper Thomson, photography by Nethaniel; (12) Serangoon Terrace, photography by Project Manhattan.