Urban space categorization
Categorizing urban space based on visitor density and diversity - A view through social media data
Analyses of urban spaces have often stressed the importance of both the density and diversity of the people they attract. However, the diversity of people is a challenging concept to operationalize within the context of urban spaces, which is why many evaluations of urban space have relied primarily on density-based measures. We argue that a focus on only one of the two aspects misses important aspects of the variety of urban spaces in our cities. To address this, we design a methodology that evaluates both the density and diversity of human behavior in urban spaces based on geosocial media data. We operationalize density as the frequency of tweets from visitors to a particular location and diversity as the variety of the home neighborhoods of those visitors. Taking Singapore as a test case, we identify networks between the home neighborhoods of 28k Twitter users based on 2.2 million geolocated tweets collected between 2012 and 2016. Based on these data, we categorize the urban landscape of Singapore into four ?performance? categories, namely High-Density/High-Diversity, High-Density/Low-Diversity, Low-Density/High-Diversity, and Low-Density/Low-Diversity. Our findings illustrate that this combined indicator provides useful nuance compared to differentiation between well and less performing spaces based on density alone. By enabling a categorization of urban spaces that fits closer to the diversity of human behavior in these spaces, human mobility data sets, such as the social media data we use, open the door to a practical evaluation of the design and planning of our heterogeneous urban environment.
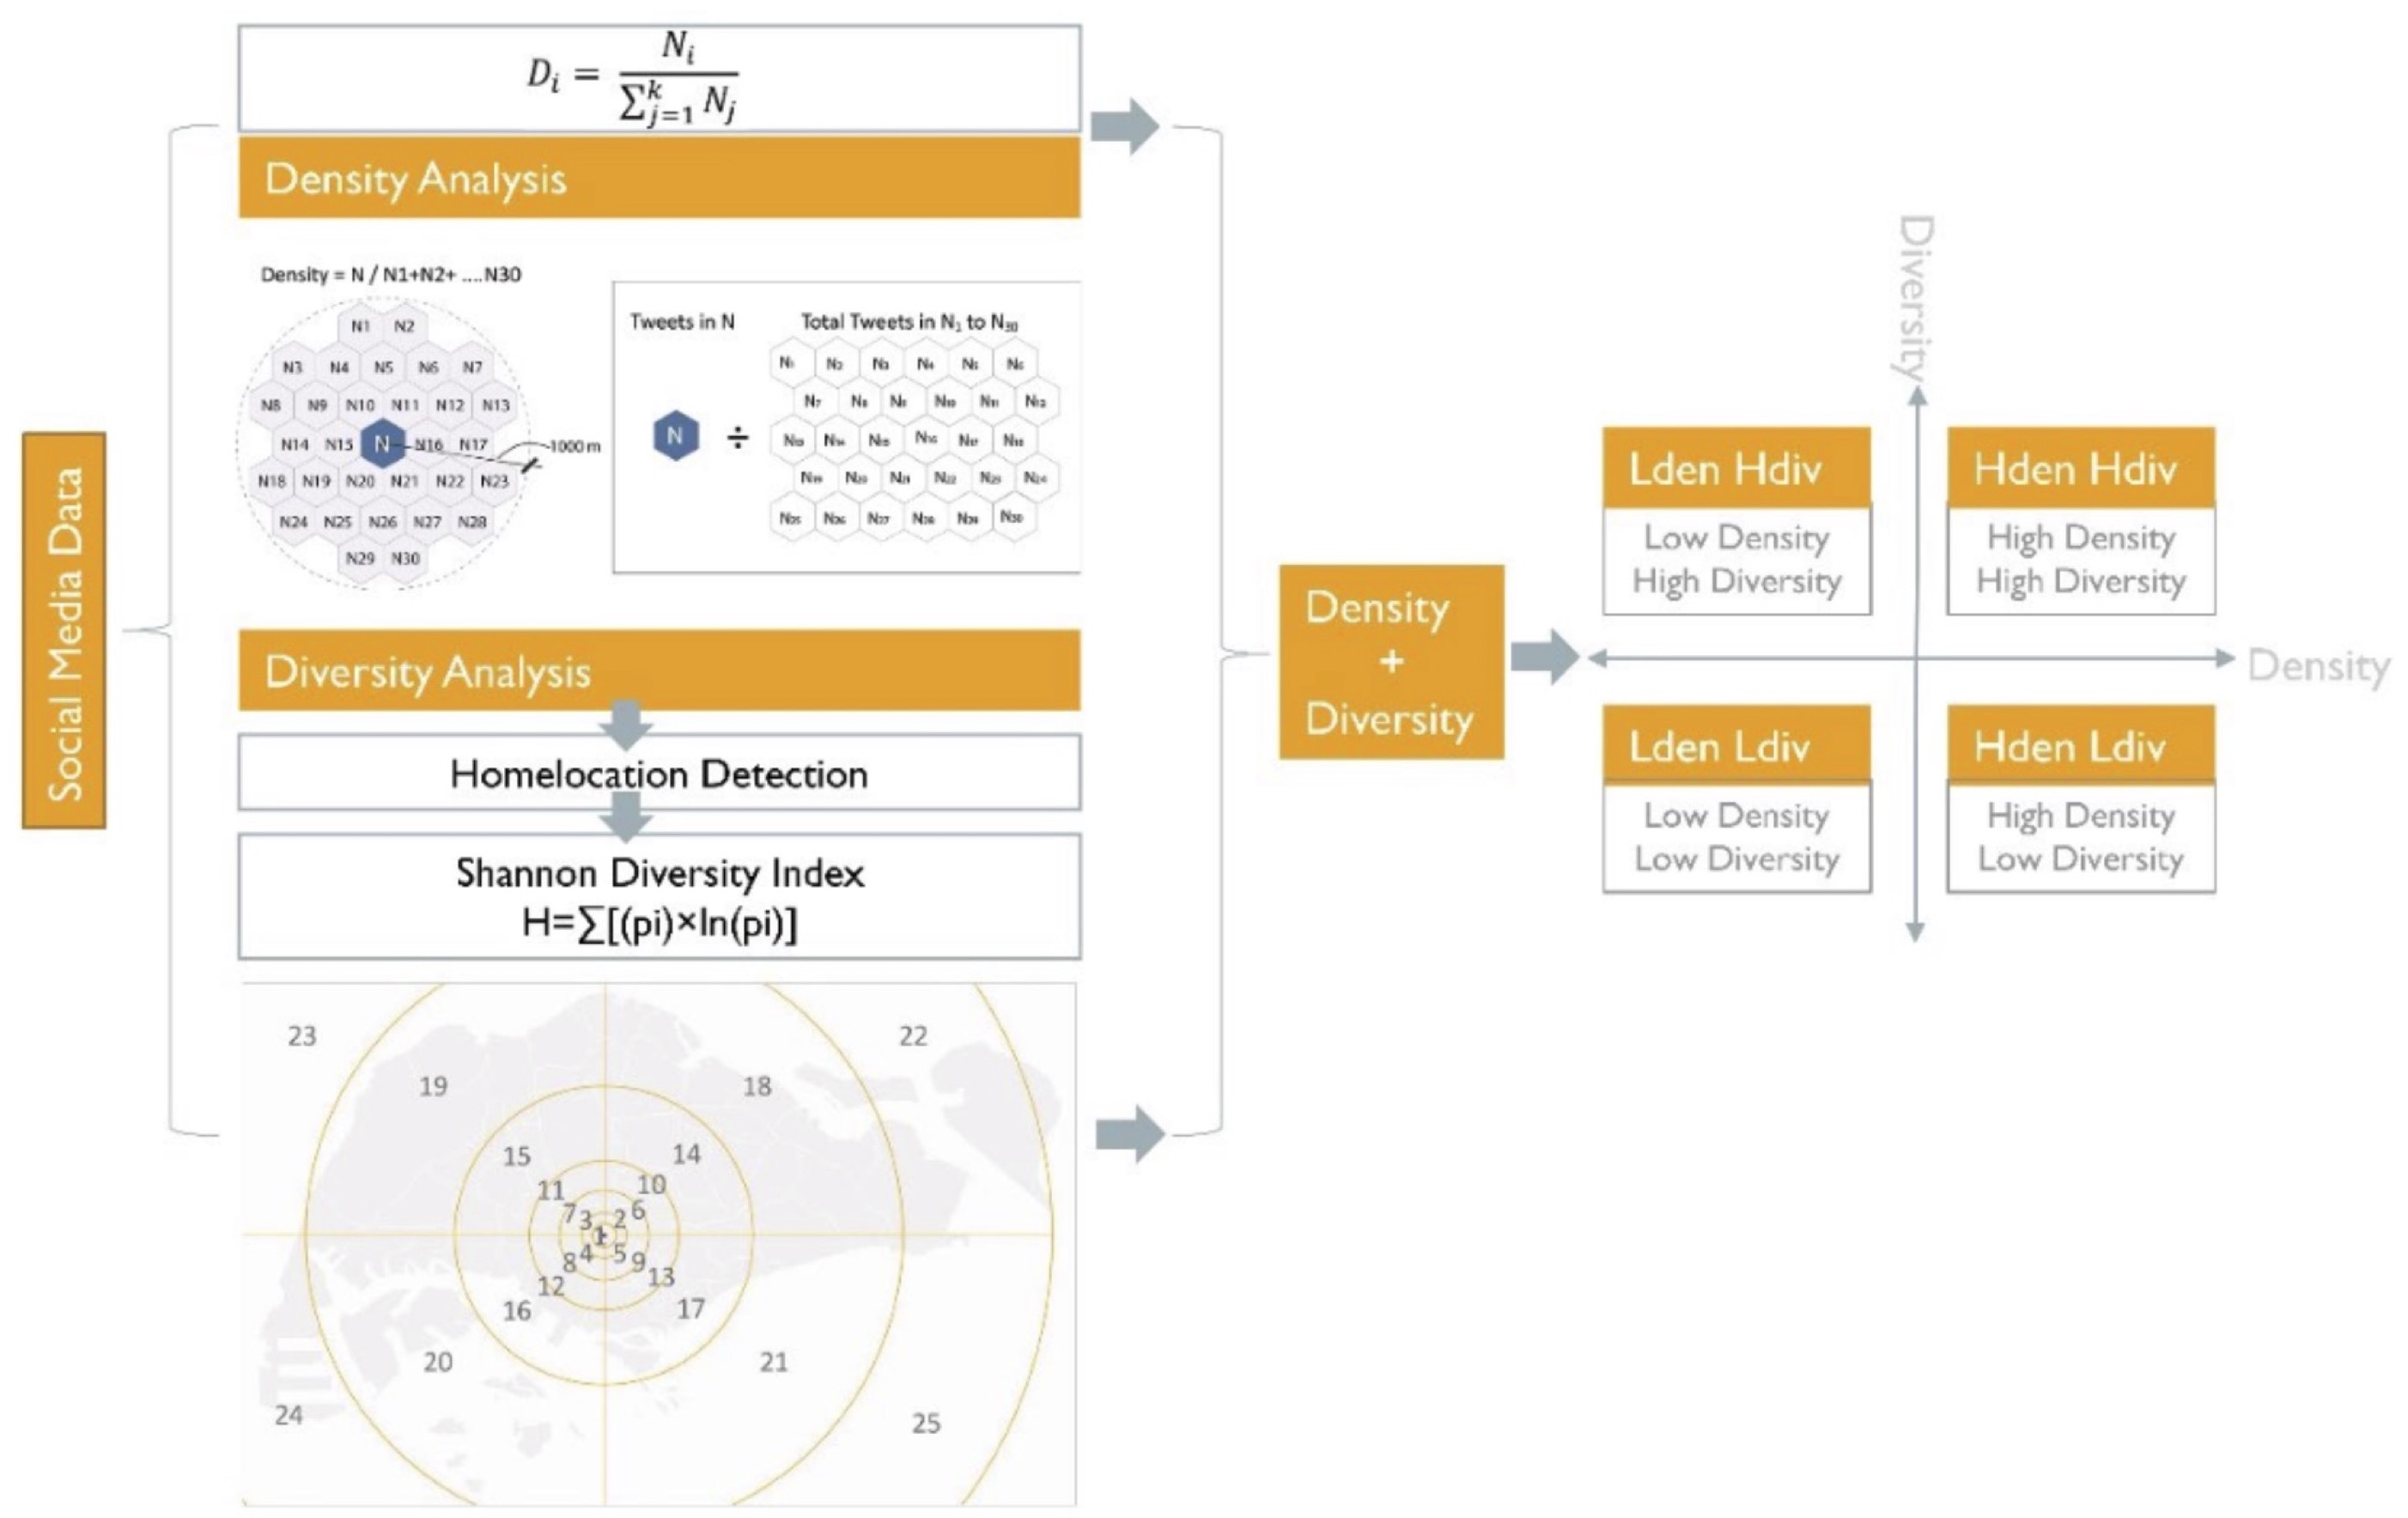
As people move around the city, they create a web—a network—of connections between the different places they visit. In this work, we infer this network of connections from Twitter data. When users opt-in to this, tweets contain explicit coordinates and timestamps that reflect the spatio- temporal path of its creator. The more often a person tweets from a place, the more likely that place is meaningful to this person and thus the stronger the connection to that location. We use these networks to ultimately understand the specific make-up of the visitors to a particular place and by extension the social diversity of a location. As such, we are able to operationalize both the density (i.e., frequency of visits) as well as the diversity of visitors (where individuals are visiting from). To illustrate our approach, we begin by evaluating the visitor density, followed by analyzing diversity based on the variety of home locations of these visitors. We then combine these two concepts into a 2x2 matrix (see Fig. 1) that allows for the categorization of activity levels in urban spaces.

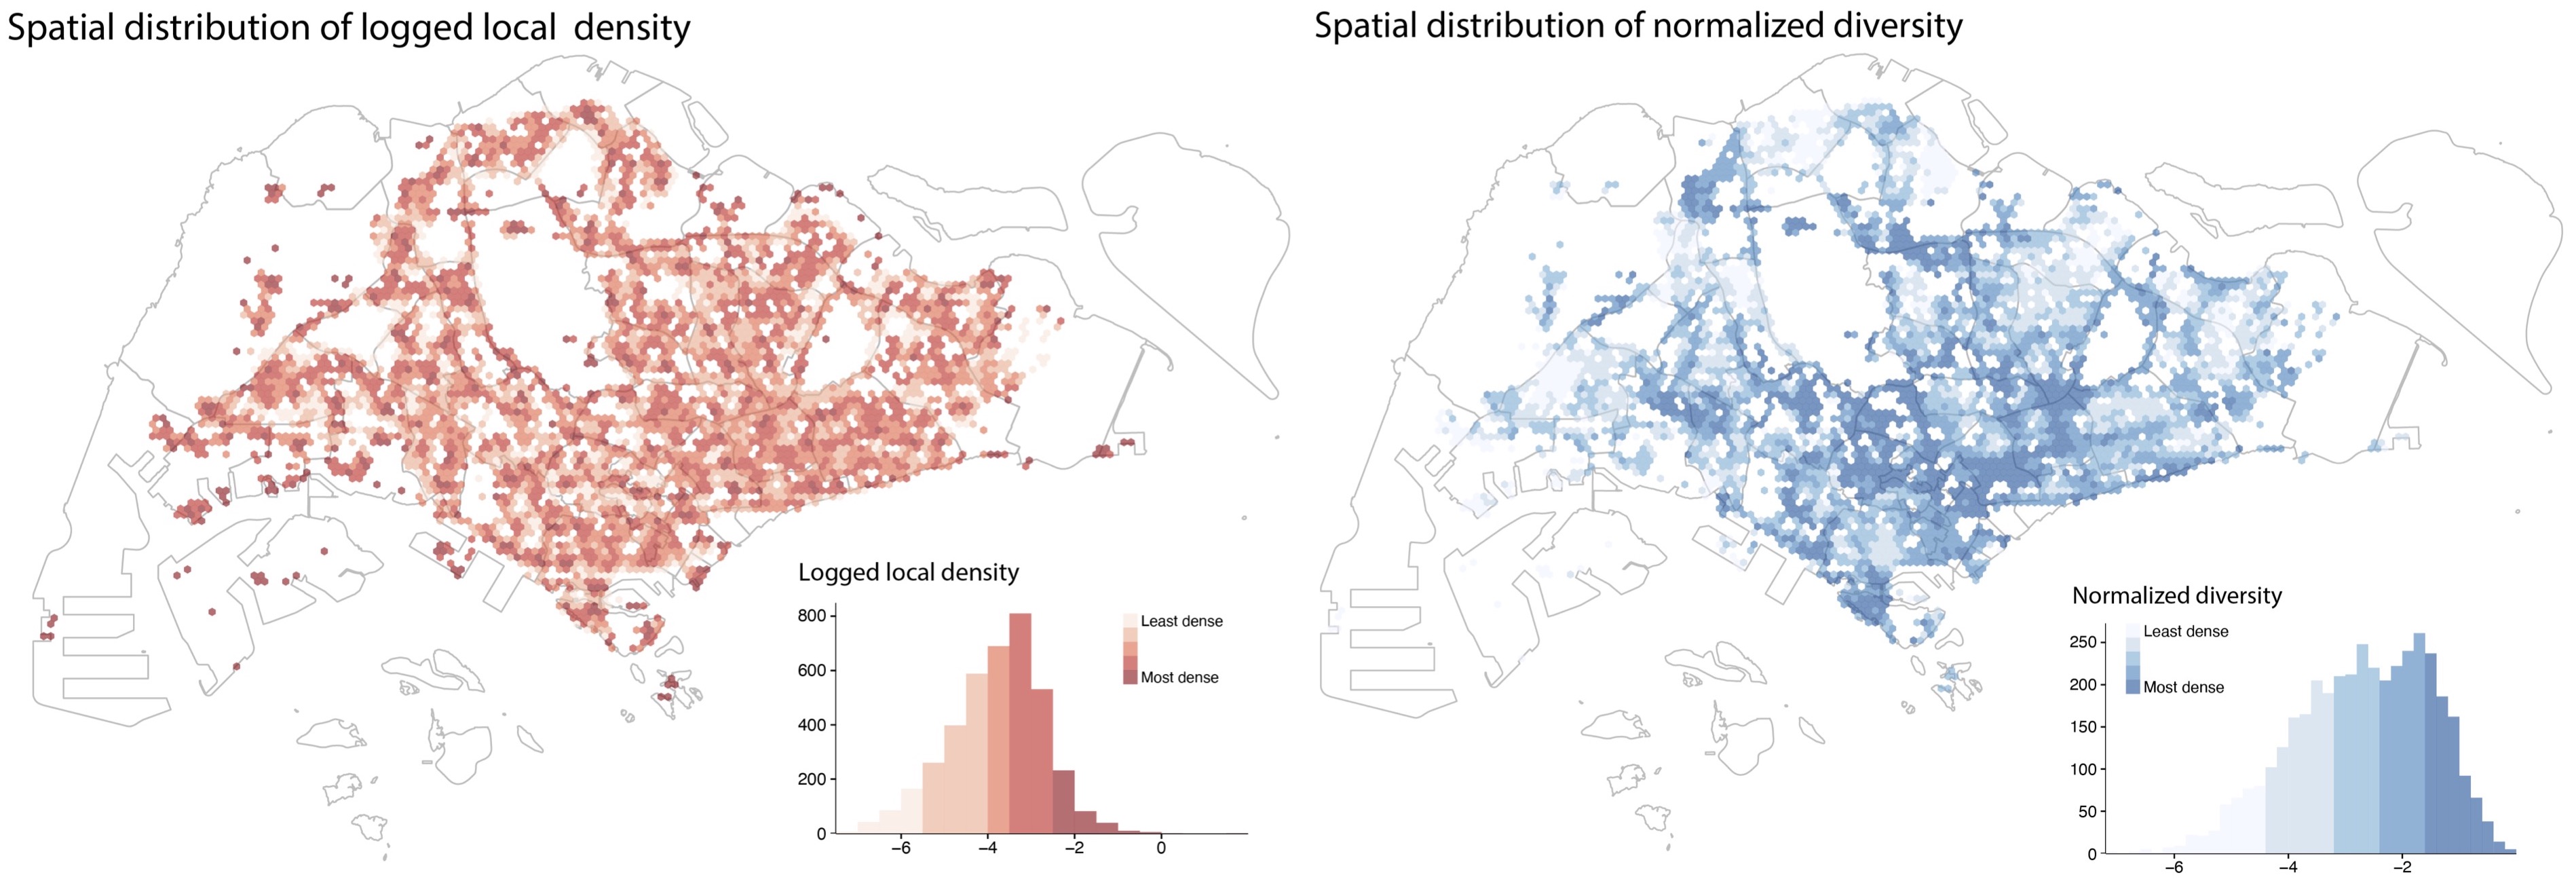
Figure 2 (left) shows the overall spatial distribution of density. To contextualize the resulting patterns, we zoom in from city-scale to neighborhood scale. The mapping of the diversity metric in Figure 2 (right) highlights the downtown area and marks the major express highways, reflecting that both roads and the downtown area generally attract a wider diversity of people than the residential neighborhoods in the peripheral ring around Singapore (colloquially referred to as “the heartlands” in Singapore).
However, the two metrics are independent of each other in the sense that high-density places can certainly have a low diversity in the origin of visitors (e.g., HDB housing), or high-diversity places can have a limited number of visitors (e.g., Tampines Eco Green). Based on either variable individually, evaluating urban space can result in a biased assumption of what a “well-performing” (high-density and high-diversity) urban space is. Therefore, we argue that both variables should be equally considered to obtain a balanced and comprehensive view of our urban spaces.

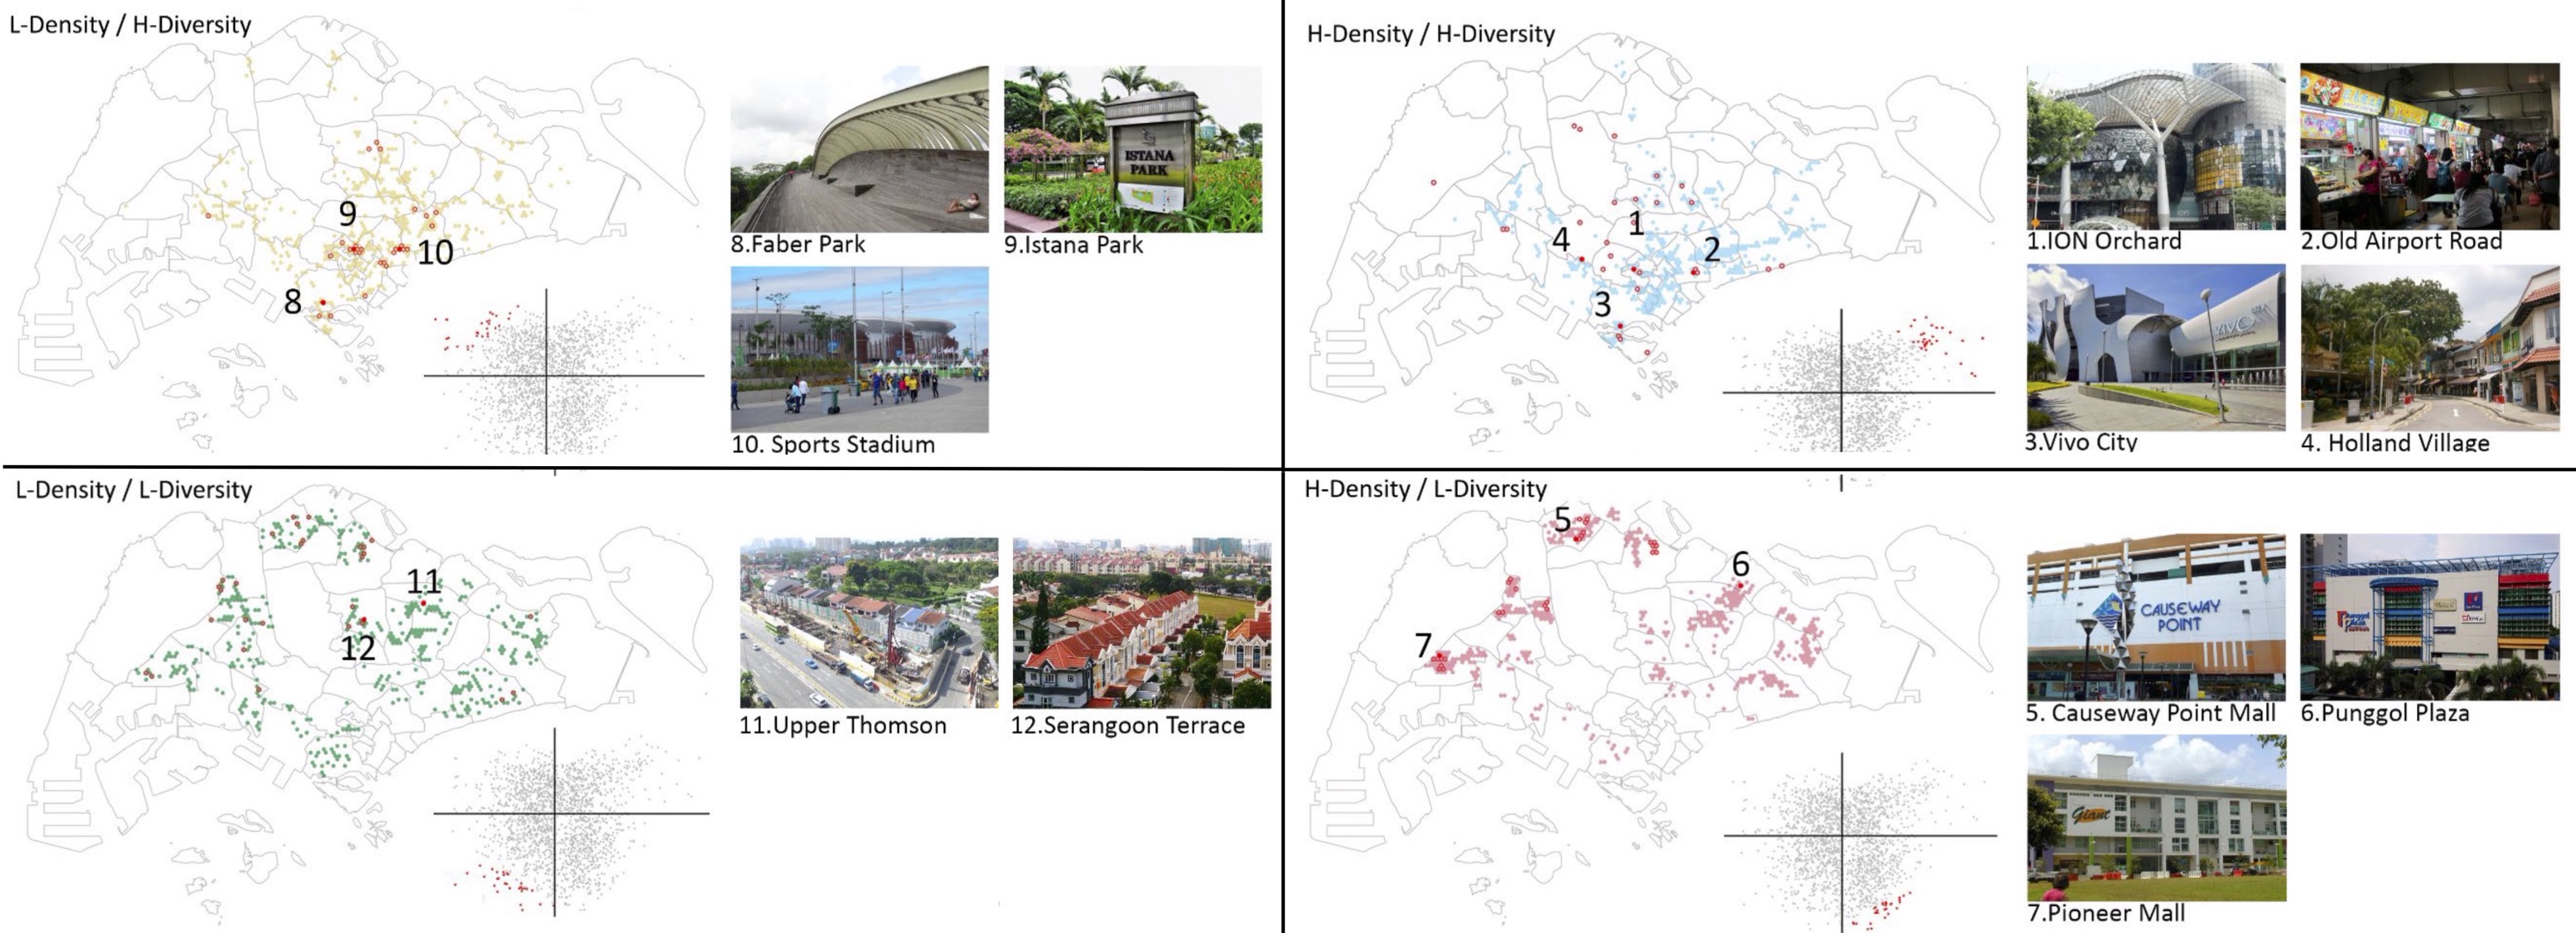
To illustrate how the combined density and diversity measure can be used to classify urban space, we take a few representative locations from the top-30 places in each category and discuss the underlying reasons that may contribute to specific activity levels in each place. Figure 3 outlines a general typology for each spatial category, where
- H-Density/H-Diversity places are prone to be high profile tourist destinations
- HarbourFront Vivo City, Holland Village, Orchard MRT station vicinity, and the Old Airport Road Food Centre are four well-known destinations. It is expected that these high-profile places would have both a high density and diversity of visitors.
- H-Density/L-Diversity places are located mostly at high density residential neighborhoods
- Woodlands Causeway Point Mall, Jurong West Pioneer Mall, and Punggol Plaza are fell in this category. These neighborhoods are Singapore’s “heartlands.” They are planned to be relatively self-contained to cater to residents’ daily needs with markets, shopping malls, cinema complexes, restaurants, and schools.
- L-Density/H-Diversity places are identified with leisure programs
- Istana Domain and green recreation spaces (e.g., Faber Park, Singapore sport stadium parks) are representative locations. The Istana is the official residence of the President of Singapore and its grounds are often used for state functions and ceremonial occasions. The result shows that the Istana incurs diverse but less dense visitor groups from different areas across the city, which is akin to the nature of its program.
- L-Density/L-Diversity places that tend to be low density with unitary urban functions
- Landed property neighborhoods at Seletar Hill and Thompson community. These locations are expected to have a lower density and diversity of visitors. Although they are less interesting from an urban design point-of-view, this category does provide a useful sanity check for the categorization we employ here.

For more details about the project, please check out our paper below:
Chuang, I.-T., Chen, Q. and Poorthuis, A. (2022). “Categorizing Urban Space based on Visitor Density and Di- versity : A View through Social Media Data”, Environment and Planning B : Urban Analytics and City Science, 0(0). https://doi.org /10.1177/23998083221139848