Vaccination debate
Analyzing the vaccination debate in social media data Pre- and Post-COVID-19 pandemic
Chen, Q., & Crooks, A. (2022). Analyzing the vaccination debate in social media data pre-and post-COVID-19 pandemic. International Journal of Applied Earth Observation and Geoinformation, 110, 102783.
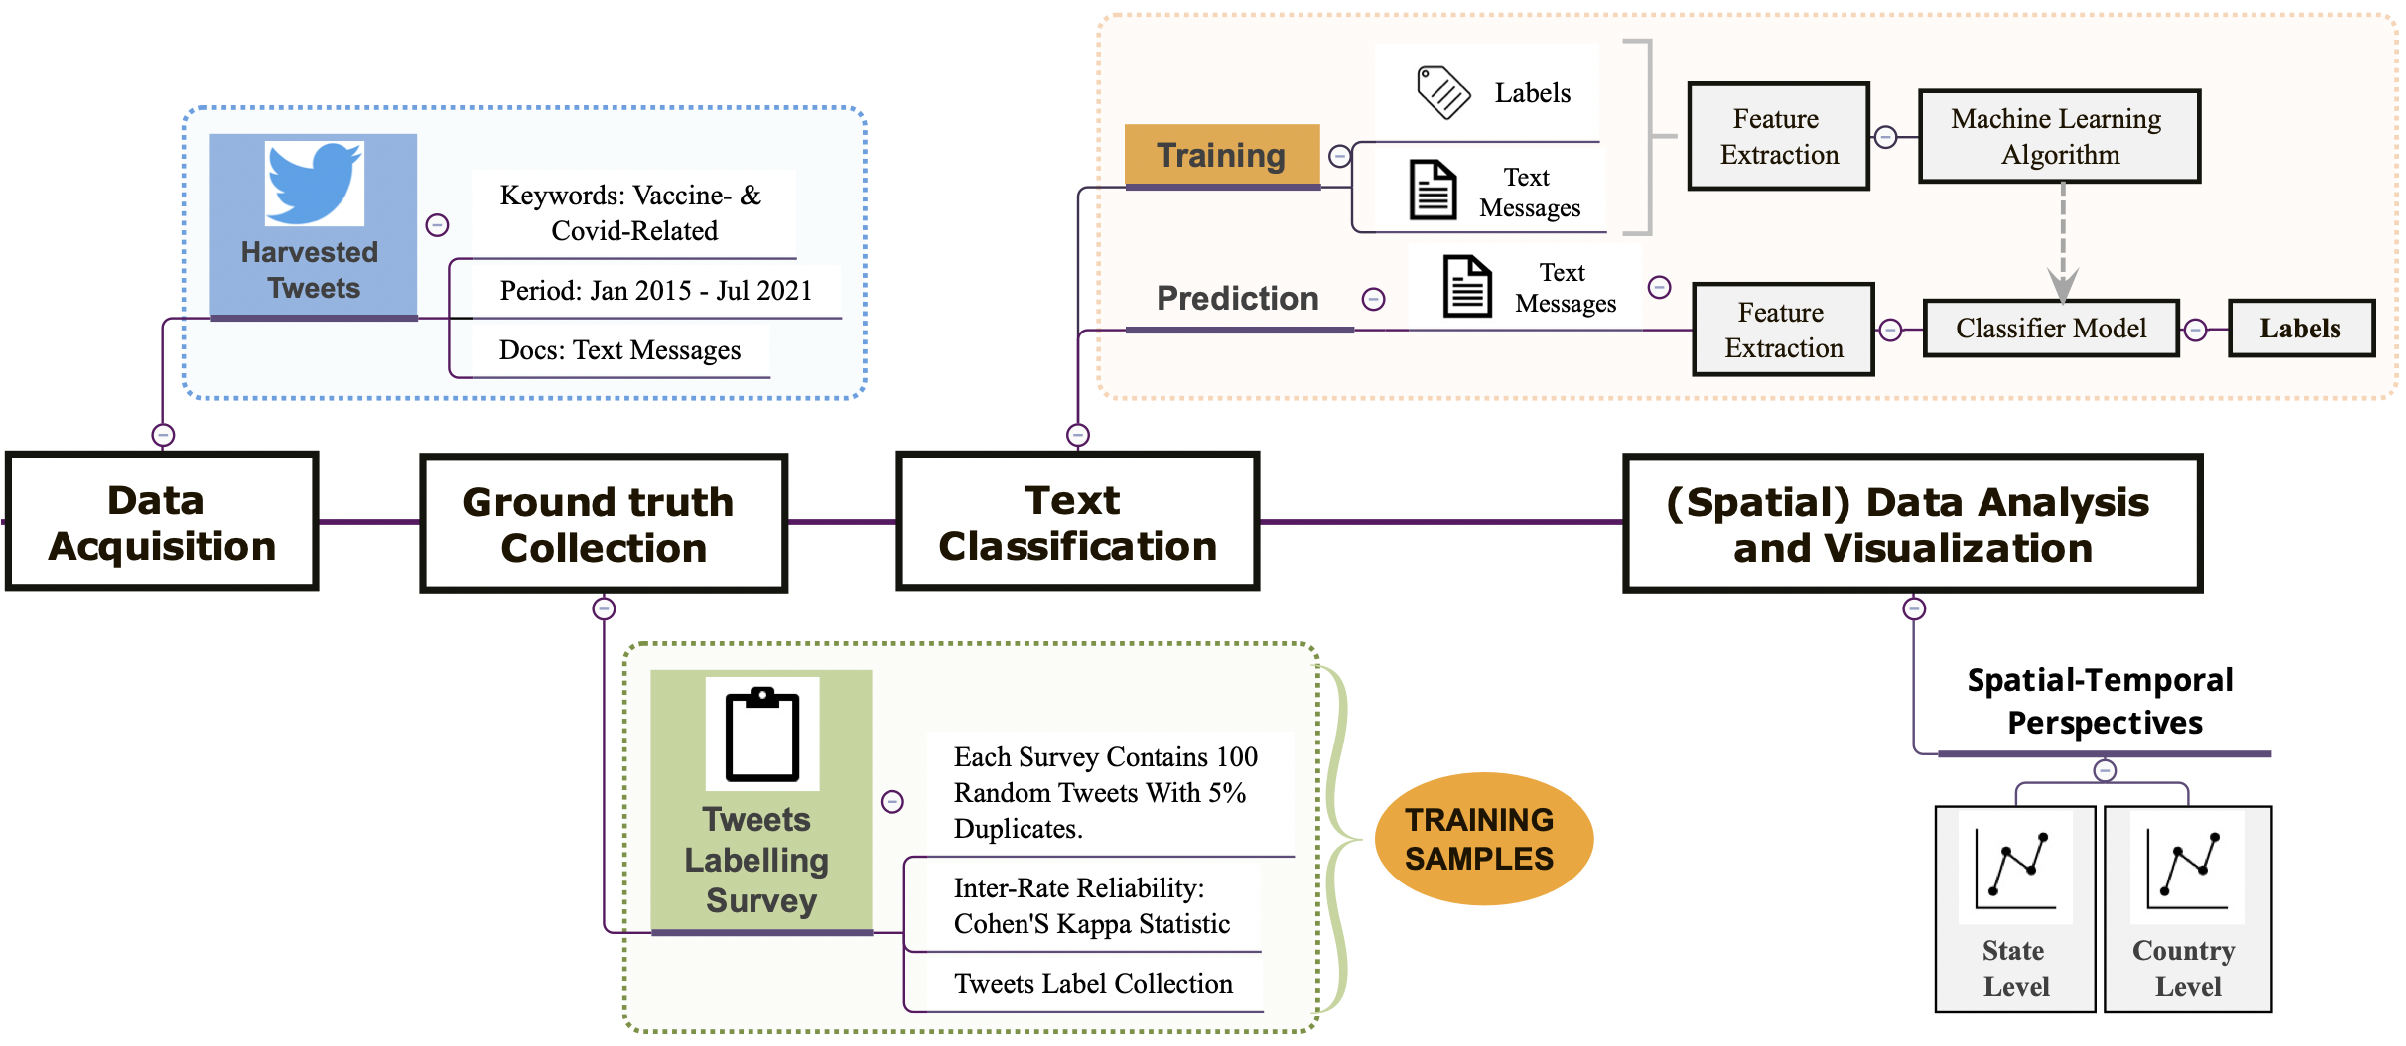
The COVID-19 virus has caused and continues to cause unprecedented impacts on the life trajectories of millions of people globally. Recently, to combat the transmission of the virus, vaccination campaigns around the world have become prevalent. However, while many see such campaigns as positive (e.g., protecting lives), others see them as negative (e.g., the side effects that are not fully understood scientifically), resulting in diverse sentiments towards vaccination campaigns. In addition, the diverse sentiments have seldom been systematically quantified let alone their dynamic changes over space and time. To shed light on this issue, we propose an approach to analyze vaccine sentiments in space and time by using supervised machine learning combined with word embedding techniques. Taking the United States as a test case, we utilize a Twitter dataset (approximately 11.7 million tweets) from January 2015 to July 2021 and measure and map vaccine sentiments (Pro-vaccine, Anti-vaccine, and Neutral) across the nation. In doing so, we can capture the heterogeneous public opinions within social media discussions regarding vaccination among states. Results show how positive sentiment in social media has a strong correlation with the actual vaccinated population. Furthermore, we introduce a simple ratio between Anti and Pro-vaccine as a proxy to quantify vaccine hesitancy and show how our results align with other traditional survey approaches. The proposed approach illustrates the potential to monitor the dynamics of vaccine opinion distribution online, which we hope, can be helpful to explain vaccination rates for the ongoing COVID-19 pandemic. Figure 1 displays an overview of the research outline.
Introduction
Over the last two decades there have been several diseases outbreaks, such as HIN1 influenza, the Ebola and Zika viruses and the current COVID-19 outbreak. Of these diseases have been more localised than others (e.g., Ebola) but without exception, they have brought tremendous economic losses and deaths. Take the ongoing COVID-19 pandemic as an example, which was declared an international public health emergency by the World Health Organization (WHO) in early 2020, it has now spread all around the world. The pandemic has affected hundreds of millions of people’s lives in many aspects including environmental, psychological, social, and economic (Saadat et al., 2020; Saladino et al., 2020; Sharifi and Khavarian-Garmsir, 2020).
In order to prevent the spread of the COVID-19 in society, governments in different countries have put in place various prevention and control measures, such as social distancing, stay-at-home constraints, closure of educational institutions, workplaces along with restricting movement either internally or externally (GÜNER et al., 2020). Although it has been seen that such counter measures for infection control can slow the transmission of the disease (Ge et al., 2022; Lai et al., 2020; Ruktanonchai et al., 2020), thus far they cannot prevent the disease from spreading totally. One possible solution however to stop the spread is that of vaccination, which can also help reduce mortality and economic losses and aid the world gradually to return to some sort of normalcy.
However, notwithstanding the continuous development and maturation of vaccine research since the 18th century (Plotkin, 2014), the implementation of vaccination campaigns is still challenging. This is mainly due to the potential impacts of vaccines on human longevity and health, such as side effects that are not fully understood scientifically, and the concerns related to religion and philosophical beliefs (Calandrillo, 2004; Phipps, 2020). These impacts and concerns have slowly taken root in people’s consciousness, resulting in diverse public sentiments (e.g., positive, negative, or neutral) towards vaccination.
With the proliferation of social media platforms, such as Facebook, Twitter, Weibo, and so on, people now have more flexibility than ever to share their attitudes regarding vaccination (Liu, 2012). However, the convenience of the digital era has also put people in an environment flooded with diverse information. The information, especially those from Anti-vaccine groups who disseminate negative views about vaccines, can alter the public’s perceptions regarding vaccination. As such, vaccine hesitancy has been identified as one of the ten main threats to global health in 2019 by the WHO (2019). Negative or hesitant vaccine sentiment raises risks of vaccine-preventable diseases (Dube et al., 2013; Puri et al., 2020), contributing to a suboptimal uptake of vaccination. From this point of view, it is crucial to understand the heterogeneous public opinions regarding vaccination so as to provide insightful informs for enhancing vaccine coverage.
One way to explore this is via sentiment analysis, which is one of the most active research fields in Natural Language Processing (NLP) and has been widely used to detect and classify sentiments from text data. Although social media platforms have the potential to amplify the negative voice of vaccination as information carriers, they also serve as digital Petri dishes, opening up a host of new possibilities for sentiment analysis by making it more affordable and convenient to collect large-scale data. Recently, researchers have used different techniques, such as lexicon-based or learning-based sentiment analysis, to assess public attitudes towards vaccination in online social media (Hu et al., 2021; Villavicencio et al., 2021; Yousefinaghani et al., 2021; Yuan et al., 2019), but most of them solely focused on a short study period, and no one to our knowledge has compared the dynamic changes of vaccine sentiments before and after a disease outbreak over a prolonged period of time. We take the promising intersection of sentiment analysis and social media data as a starting point to further unpack the potential dynamic changes of the public’s vaccine attitudes over a long-term period. We argue that sentiment analysis lens on large-scale social media data can complement understanding public opinions regarding vaccination based on survey research with views from both spatial and temporal perspectives.
To illustrate this potential, we took the United States as a test case and utilized a Twitter dataset from January 2015 to July 2021. We started by developing a classifier to detect three vaccine sentiments (Pro-vaccine, Anti-vaccine, and Neutral) based on an approach that combines machine learning and word embedding techniques. Subsequently, taking the time of the COVID-19 outbreak as the demarcation point, we divided the study period into two phases - before and after the COVID-19 outbreak. In doing so, we can compare the three vaccine sentiments before and after the outbreak and as such reveal specific changes or trends in public attitudes towards vaccination in the United States. Moreover, we proposed a metric (A2P Ratio) derived from the identified Pro- and Anti-vaccine sentiments to evaluate the vaccine hesitancy and validated it with the estimated vaccine hesitancy from Centers for Disease Control and Prevention (CDC).
Doing this allows us to address questions such as of what is the dominant vaccine sentiment before and after the outbreak? Did vaccine sentiment change over time and where did such changes take place? What are the relationships between different vaccine sentiments and the actual vaccination rates? These questions - and others alike - have direct policy implications. Such as discussions surrounding the topics of the effectiveness of interventions/strategies for enhancing vaccine uptake and immunization coverage, and the psychological, social, and political factors that sustain public trust in vaccines (Larson et al., 2011; Odone et al., 2015). We argue that tracking the dynamics of vaccine sentiments over space and time can generate informed insights for these questions. This is especially the case when combined with the analytical latitude offered by social media data that give more possibilities for assessing vaccine sentiments at larger scales in terms of space and time.
Text sentiment classification
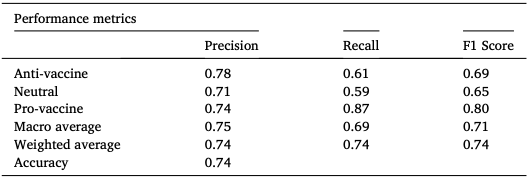
To operationalize the proposed method, we first conducted a series of text cleaning, which generally relates to removing noise in the contents that do not contribute the classification process (e.g., multiple consecutive same characters, Unicode characters, hashtags, URLs, etc). Afterwards, we applied Word2Vec to convert words mathematically into a vector representation. The embeddings were then used as the input in a set of machine learning algorithms for classification, including Naive Bayes, Support Vector Machine (SVM), Logistic Regression, and Extreme Gradient Boosting (XGBoost) in order to see which one provides the best performance. To optimize the model performance, 5-fold Cross-Validation (CV) and hyperparameter tuning were applied. By comparing the performance on the test set, we found XGBoost stands out from other algorithms with an accuracy of 74%. Then, the XGBoost classifier was applied to detect the sentiments (i.e., Pro-vaccine, Anti-vaccine, Neutral) of each tweet in the rest data corpus.
Vaccine hesitancy estimation
In addition to detecting the three sentiments (Pro-vaccine, Anti- vaccine, Neutral), we took one step further to analyze vaccine hesitancy. We proposed a metric called **A2P Ratio** (i.e., the ratio of Anti-vaccine to Pro-vaccine) as a simple proxy to quantify vaccine hesitancy due to its nuanced nature. The larger the ratio, the higher the vaccine hesitancy. To validate the proposed metric, we further compared it with the estimated vaccine hesitancy from CDC at the state level. By doing so, we are able to identify the potential correlation between the two, so as to use the “A2P Ratio” as a simple proxy to quantify vaccine hesitancy in a more efficient way. However, it is important to stress that the “A2P Ratio” introduced here only focuses on sentiment derived from the online vaccination discussions, and as such works as a simple alternative way to provide informed insights into vaccine hesitancy. Yet, to develop a more comprehensive understanding of vaccine hesitancy will require incorporating many other factors aforementioned, such as demographic, political, cultural factors which is beyond the scope of the current paper.
Results
Figure 3 shows the distribution of vaccination sentiment from 2015 to 2021 at state level. We can see that for most states, the rate of “Anti-vaccine” users increased in 2020 compared to 2019 and showed a minimal drop in 2021, while the changes in the rate of “Pro-vaccine” users over time are the opposite.
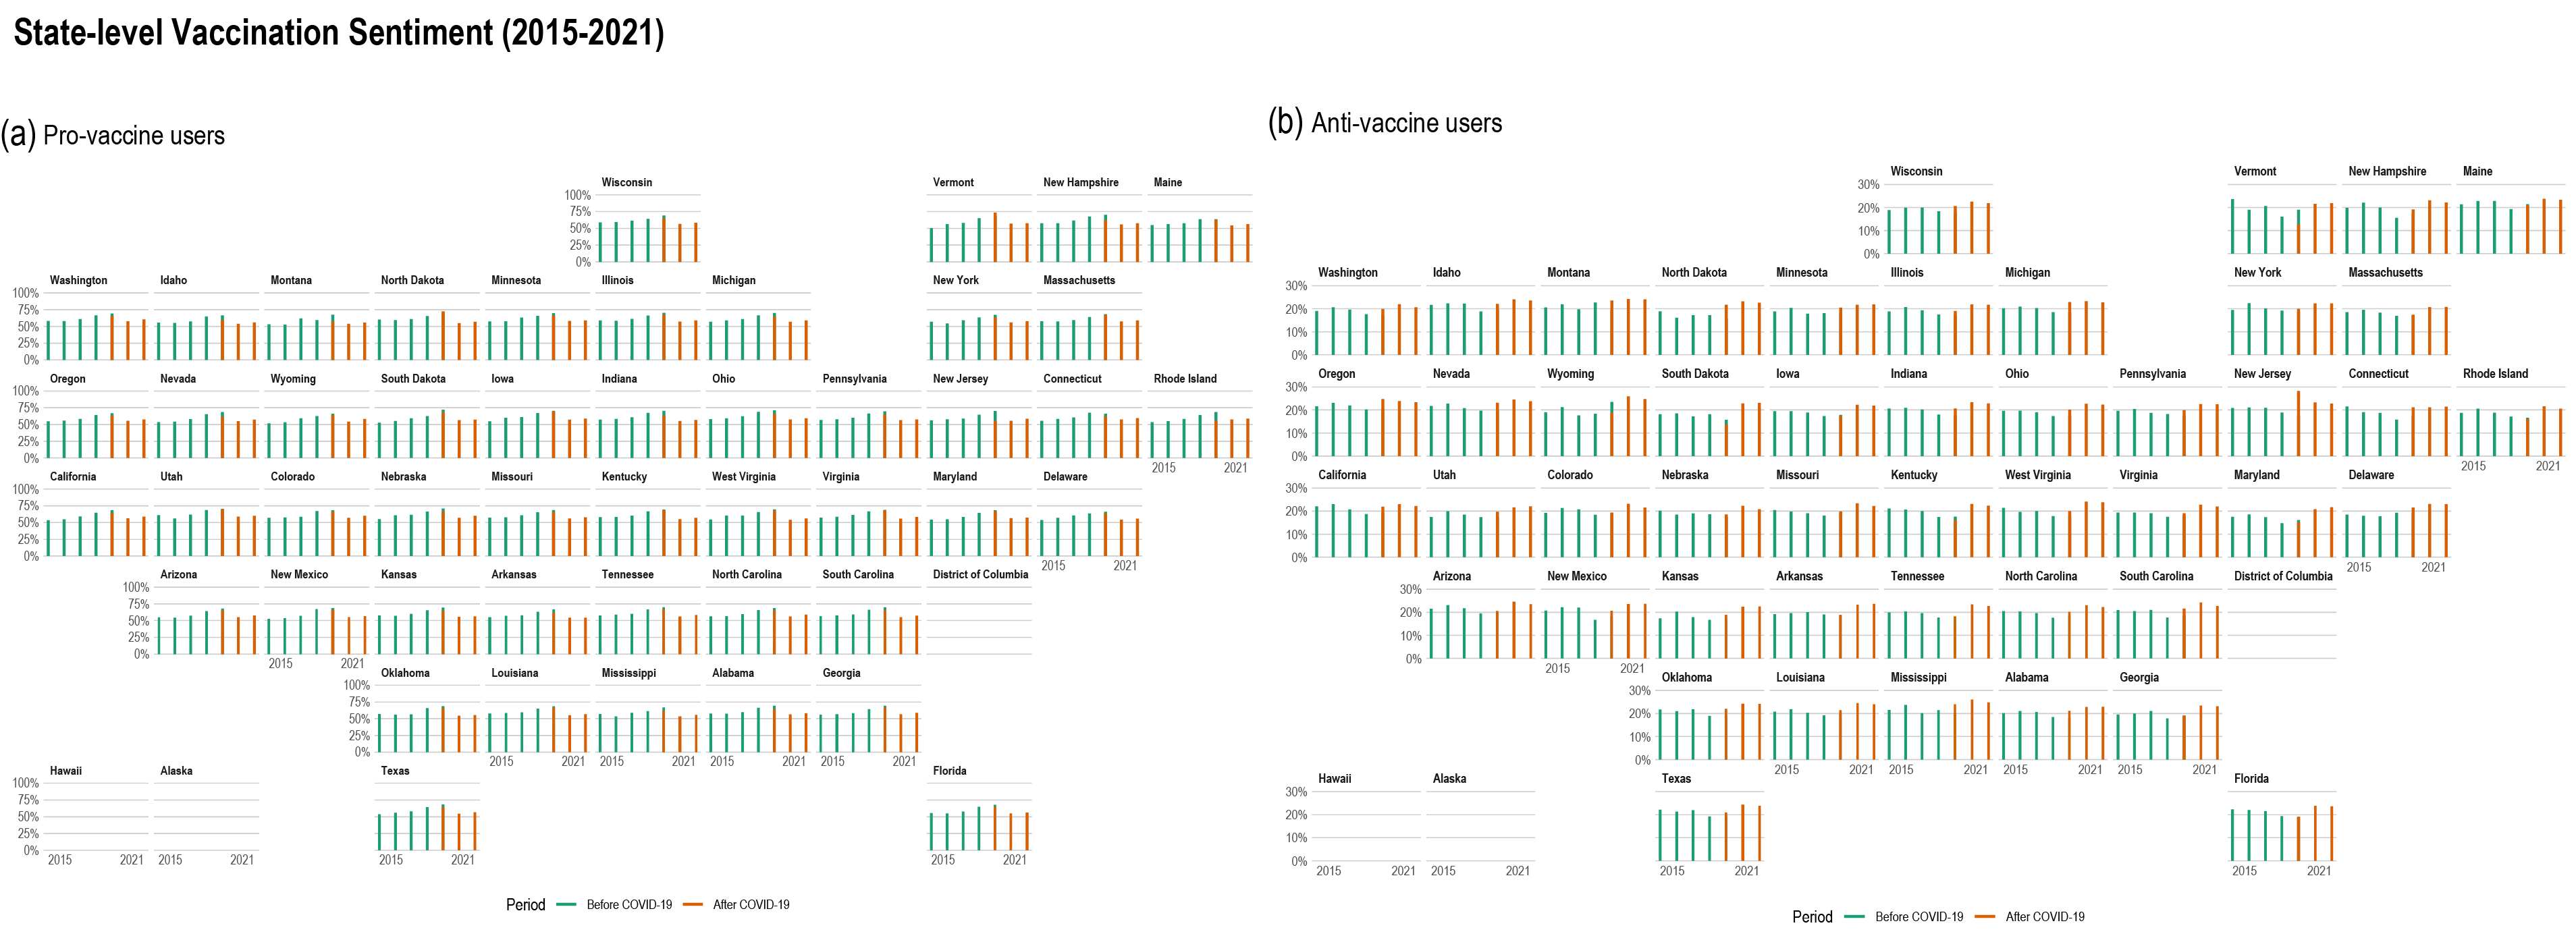
Figure 2. Distribution of state-level vaccination sentiment from 2015 to 2021. (a) Percentage of Pro-vaccine users; (b) Percentage of Anti-vaccine users.
Moreover, in order to understand the potential correlation between the positive vaccine attitude online and the actual vaccination rate offline, especially after the COVID-19 outbreak, we compared the odds ratio of the Pro-vaccine users after the outbreak to that of the coronavirus vaccinations in each state.
\[OR_{\text{Pro-vaccine}} = \frac{\frac{N_{\text{Pro-vaccine users in a state}}}{N_{\text{Pro-vaccine users in the US}}}}{\frac{N_{\text{Twitter users in a state}}}{N_{\text{Twitter users in the US}}}}\]Figure 3 (a) & (b) display the spatial distribution of the odds ratios of the “Pro-vaccine” users and vaccination records, separately. The results reveal there was geographic difference in Pro-vaccine sentiment on Twitter. More specifically, states, such as Massachusetts (MA), Con- necticut (CT), Vermont (VT), Colorado (CO), Washington (WA), New York (NY), had relatively higher Pro-vaccine odds than other states (see Fig. 3 (a)). Part of the reason for this could be attributed to the relatively complete health system in these states as it has been shown that a well-functioning health system is crucial for improving vaccine coverage. Our finding follows a similar trend to that of the actual vaccination rate (see Fig. 3 (b)), which implies the positive attitude regarding vaccines identified from the social media data can, to some extent, reflect the actual vaccination rate offline. This was further validated by measuring the correlation coefficient between the two. Figure 3 (c) presents the correlation between the odds ratio of actual vaccination records and the odds ratio of Pro-vaccine users, where a positive correlation (R = 0.67, R2 = 0.45) between the two was observed. We argue that the proposed approach for identifying positive vaccine sentiments online can be used as an indicator for evaluating offline vacci- nation rates.
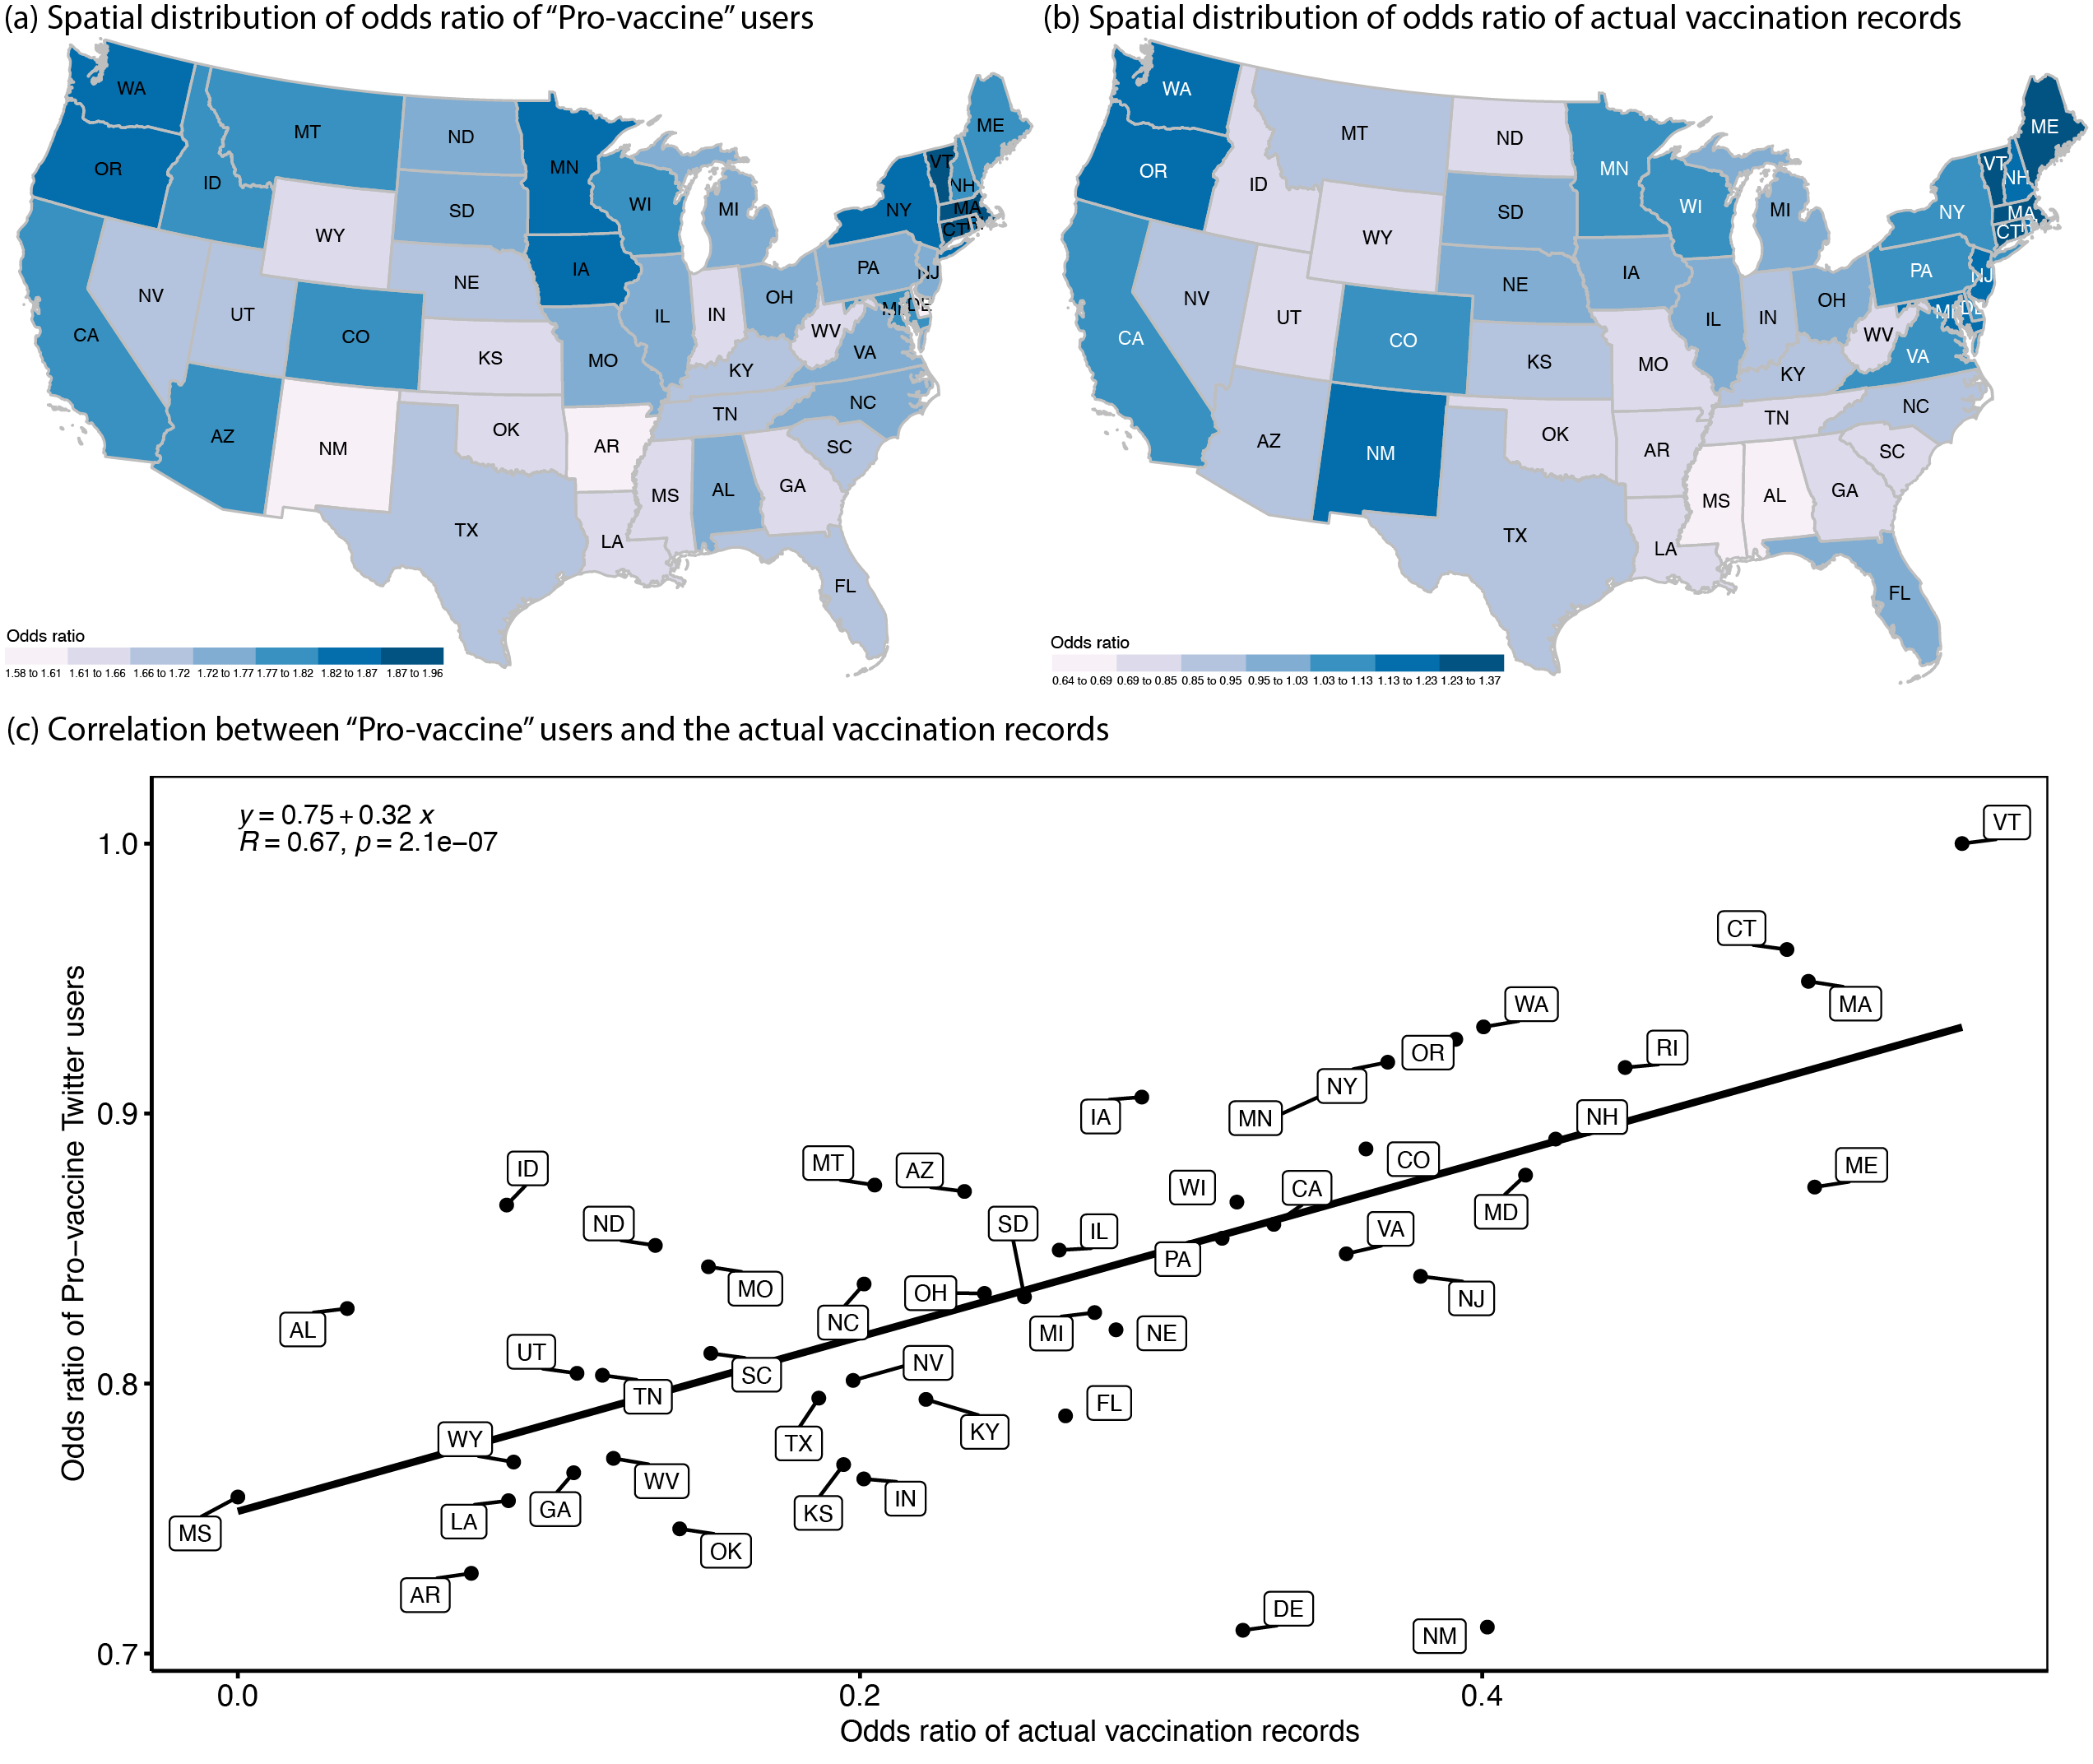
Figure 3. Correlation between Pro-vaccine users and actual vaccination records. (a) Spatial distribution of odds ratio of Pro-vaccine users; (b) Spatial distribution of odds ratio of actual vaccination records; (c) Correlation between the Pro-vaccine users and the actual vaccination records.
To demonstrate public’s attitudes identified from online vaccine discussion can be useful for predicting the tendency of vaccines hesitancy offline, we used the A2P Ratio as a proxy of vaccine hesitancy prediction and compared it with the estimated vaccine hesitancy rate from CDC, which is measured based on the U.S. Census Bureau’s Household Pulse Survey (HPS) (see Fig. 4). We observed that relatively higher A2P ratios and estimated vaccine hesitancy are mostly entrenched in states in the West and South, such as Wyoming (WY), Arkansas(AR), Florida (FL), Louisi- ana (LA), Nevada (NV), and so on. Besides this, we also observed that WY stood out from the other states in both maps, appearing as the most vaccine-hesitant state in the country. An important reason may be the inequality in resources allocation and distribution. Other possible reasons could be, for example, cultural conservatism, safety concerns, distrust of government, low health literacy, and so on. The results indicate the proposed A2P ratio has the ability to capture a comparable pattern as the estimated vaccine hesitancy obtained from a survey research. To quantified the relationship between the two, we conducted a correlation analysis and found they indeed had a positive correlation (R = 0.66, R2 = 0.43) as shown in Fig. 4. This finding implies the proposed A2P ratio can effectively estimate vaccine hesitancy, complementing the limitations of vaccine hesitancy based on survey research, such as difficulties in scaling up, time-consuming, and labor-intensive.
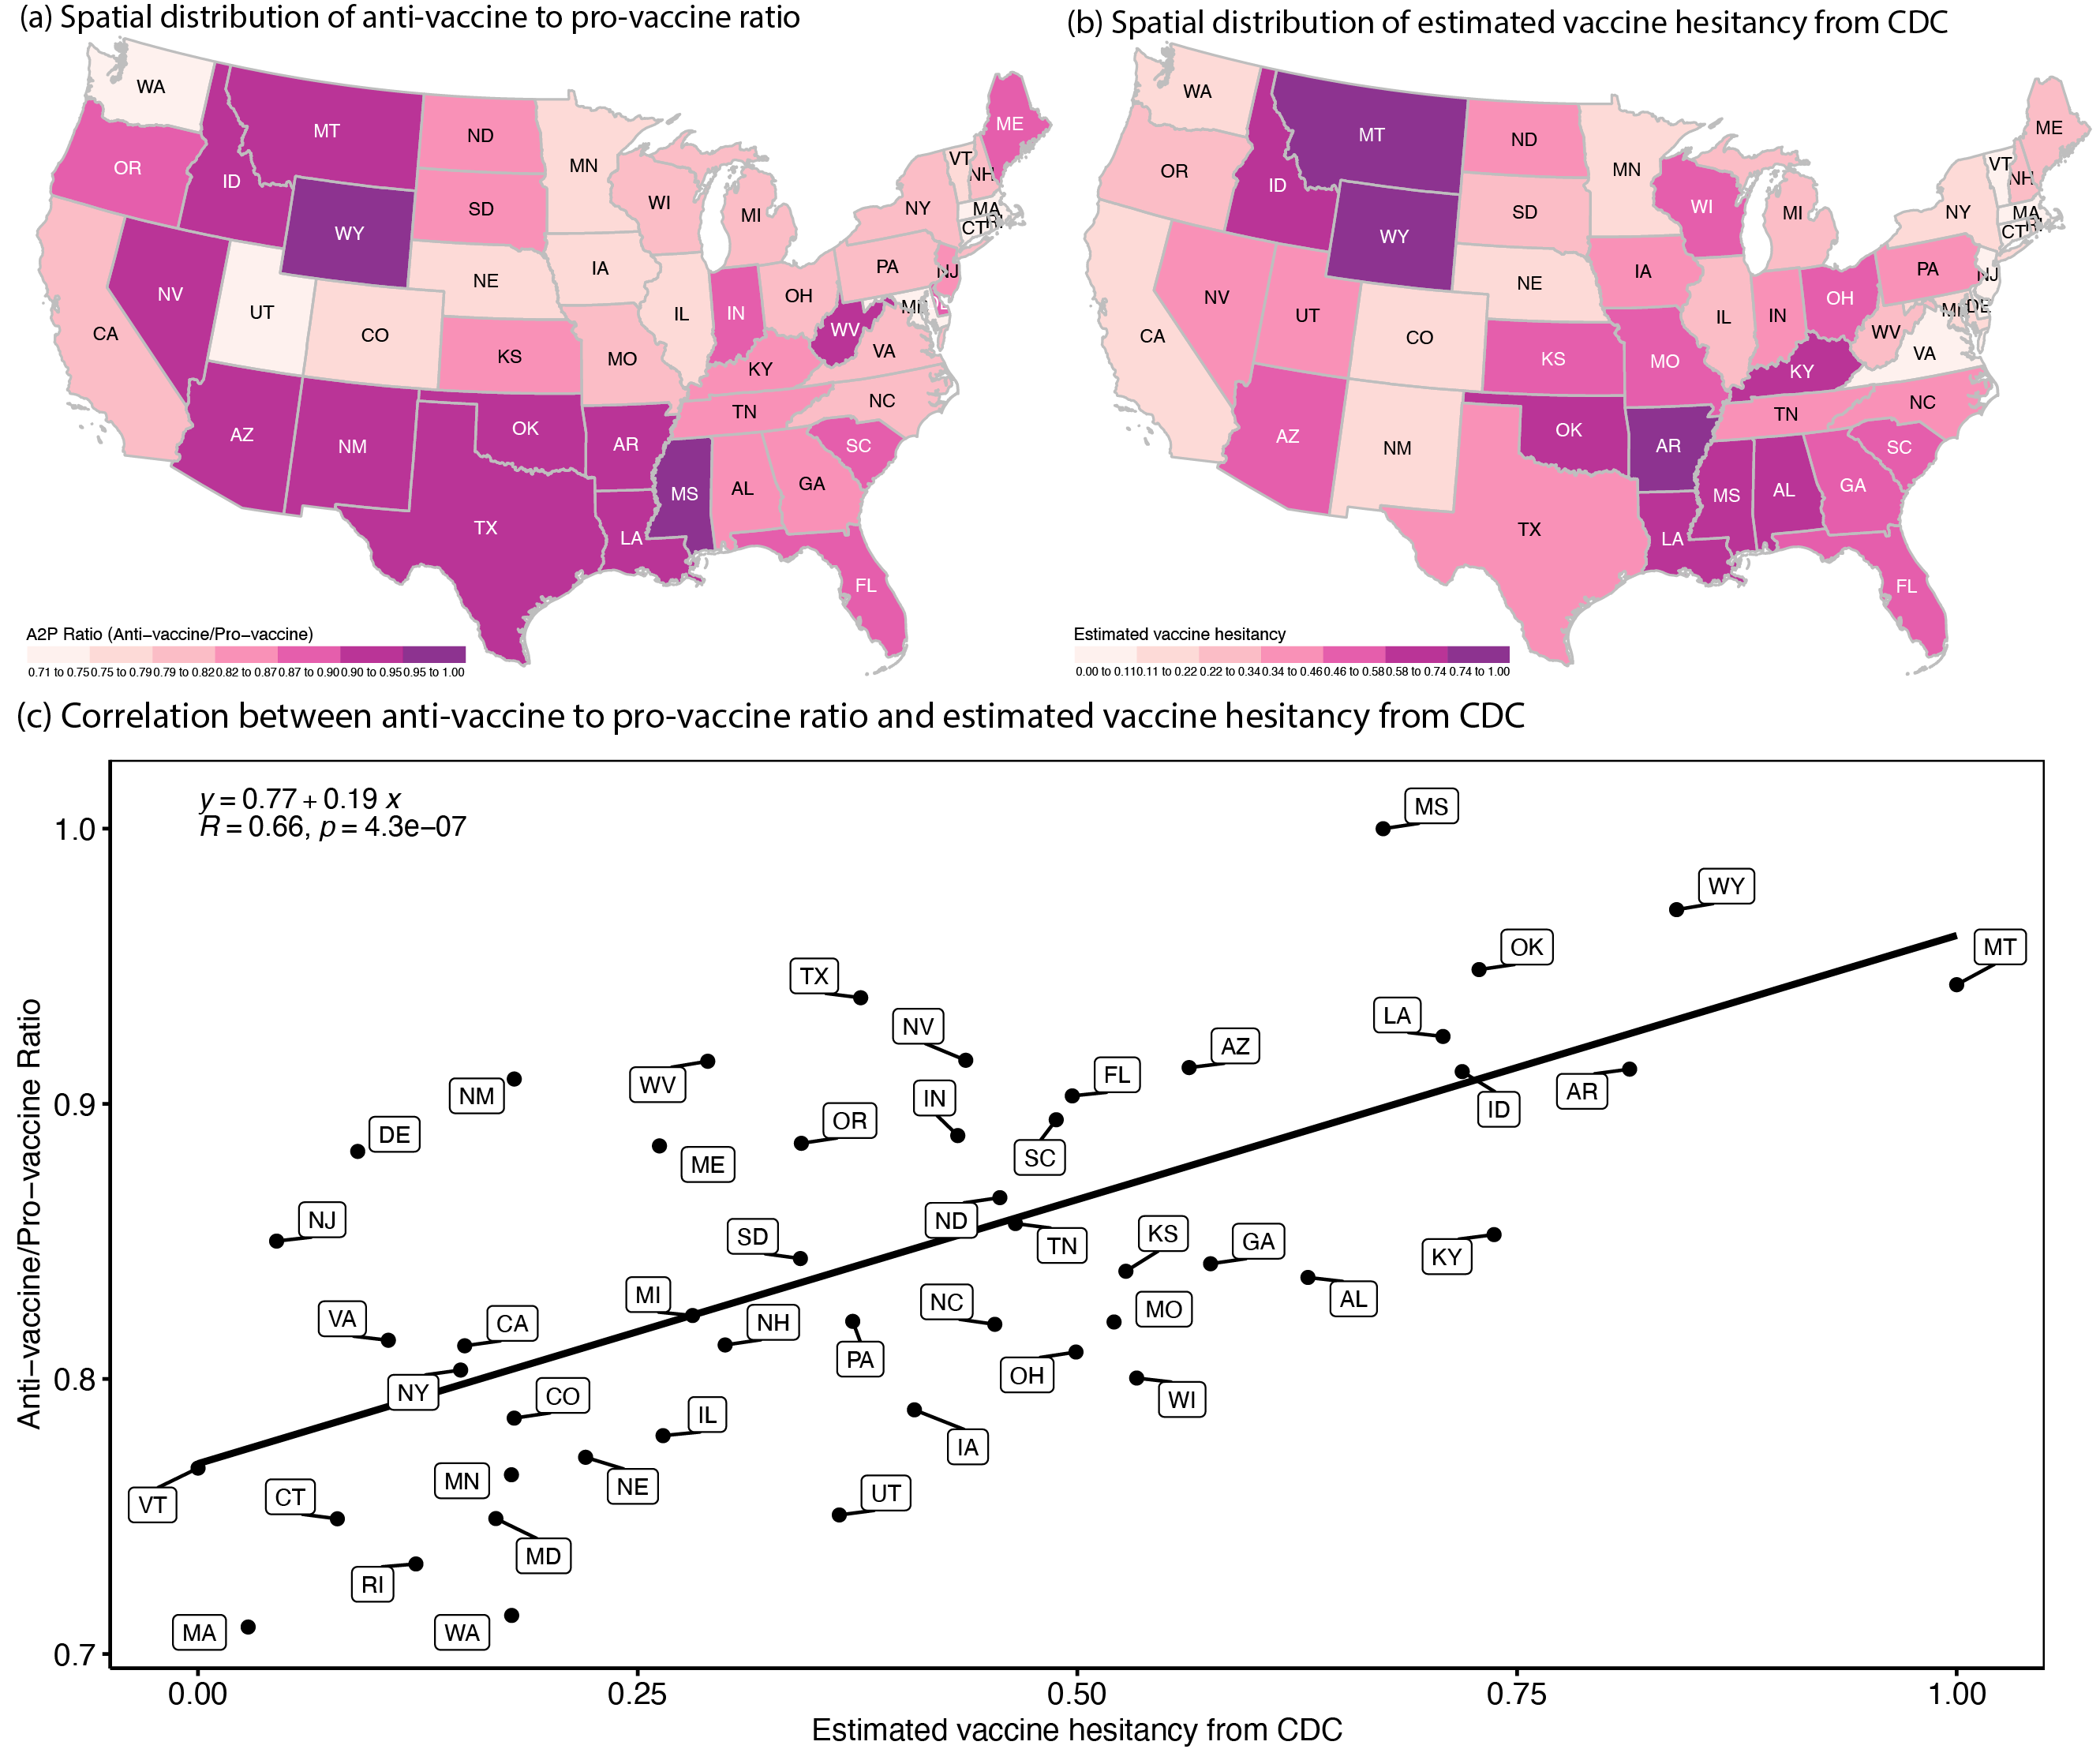
Figure 4. Right: Vaccine hesitancy (a) Spatial distribution of Anti-vaccine to Pro-vaccine ratio; (b) Spatial distribution of estimated vaccine hesitancy from CDC; (c) Cor- relation between Anti-vaccine to Pro-vaccine ratio and the estimated vaccine hesitancy from CDC.